| Param | Original file | Final file |
|---|---|---|
| Filename | modeM0/AS1A13_065T02_9000005922cztM0_level2.fits | modeM0/AS1A13_065T02_9000005922cztM0_level2_quad_clean.evt |
| Size (bytes) | 169,191,360 | 163,739,520 |
| Size | 161.4 MB | 156.2 MB |
| Events in quadrant A | 784,936 | 675,898 |
| Events in quadrant B | 1,019,308 | 1,031,596 |
| Events in quadrant C | 1,050,616 | 1,005,408 |
| Events in quadrant D | 840,414 | 821,715 |
| Mode M9 | |||
|---|---|---|---|
| Quadrant | BADHDUFLAG | Total packets | Discarded packets |
| A | 0 | 18 | 0 |
| B | 0 | 18 | 0 |
| C | 0 | 18 | 0 |
| D | 0 | 18 | 0 |
| Mode SS | |||
|---|---|---|---|
| Quadrant | BADHDUFLAG | Total packets | Discarded packets |
| A | 0 | 416 | 0 |
| B | 0 | 416 | 0 |
| C | 0 | 416 | 0 |
| D | 0 | 416 | 0 |
| Mode M0 | |||
|---|---|---|---|
| Quadrant | BADHDUFLAG | Total packets | Discarded packets |
| A | 0 | 109666 | 0 |
| B | 0 | 48139 | 0 |
| C | 0 | 47006 | 0 |
| D | 0 | 74104 | 0 |
| Quadrant | Total seconds | Saturated seconds | Saturation percentage |
|---|---|---|---|
| A | 20671 | 9006 | 43.568284% |
| B | 20671 | 609 | 2.946156% |
| C | 20671 | 358 | 1.731895% |
| D | 20671 | 2778 | 13.439118% |
Noise dominated data is calculated using 1-second bins in cleaned event files. If a bin has >2000 counts, and if more than 50% of those come from <1% of pixels, then it is considered to be noise-dominated and hence unusable.
| Quadrant | # 1 sec bins | Bins with >0 counts | Bins with >2000 counts | High rate bins dominated by noise | Noise dominated (total time) | Noise dominated (detector-on time) | Marked lightcurve |
|---|---|---|---|---|---|---|---|
| A | 22391 | 19817 | 0 | 0 | 0.00% | 0.00% |  |
| B | 22391 | 20665 | 0 | 0 | 0.00% | 0.00% |  |
| C | 22392 | 20667 | 0 | 0 | 0.00% | 0.00% |  |
| D | 22392 | 20616 | 0 | 0 | 0.00% | 0.00% |  |
Top three noisy pixels from each quadrant. If the there are fewer than three noisy pixels in the level2.evt file, extra rows are filled as -1
| Pixel properties | Quadrant properties | ||||||
|---|---|---|---|---|---|---|---|
| Quadrant | DetID | PixID | Counts | Sigma | Mean | Median | Sigma |
| A | 0 | 29 | 669 | 8.86 | 205 | 192 | 53.9 |
| A | 7 | 110 | 658 | 8.65 | 205 | 192 | 53.9 |
| A | 0 | 30 | 629 | 8.11 | 205 | 192 | 53.9 |
| B | 2 | 9 | 927 | 12.02 | 269 | 255 | 55.9 |
| B | 3 | 17 | 801 | 9.77 | 269 | 255 | 55.9 |
| B | 5 | 232 | 706 | 8.07 | 269 | 255 | 55.9 |
| C | 1 | 81 | 836 | 7.76 | 278 | 258 | 74.5 |
| C | 3 | 202 | 834 | 7.73 | 278 | 258 | 74.5 |
| C | 1 | 80 | 788 | 7.11 | 278 | 258 | 74.5 |
| D | 6 | 67 | 616 | 5.75 | 242 | 219 | 69.0 |
| D | 3 | 14 | 613 | 5.71 | 242 | 219 | 69.0 |
| D | 10 | 113 | 606 | 5.61 | 242 | 219 | 69.0 |
Histogram calculated using DETX and DETY for each event in the final _common_clean file
| Quadrant A |  |
 |
Quadrant B |
|---|---|---|---|
| Quadrant D | 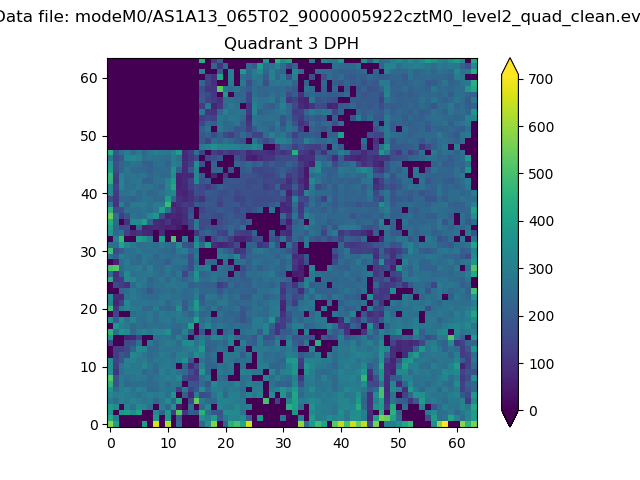 |
 |
Quadrant C |
| Plot type | Count rate plots | Images |
|---|---|---|
| Comparison with Poisson distribution Blue bars denote a histogram of data divided into 1 sec bins. Red curve is a Poisson curve with rate = median count rate of data. |
 |
 |
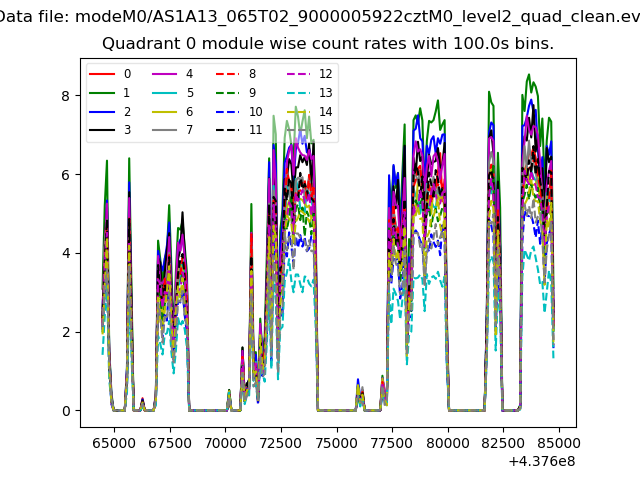
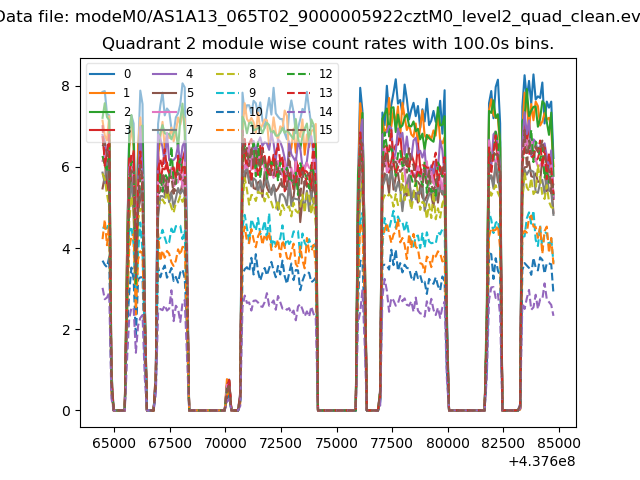
| Quadrant-wise count rates Data is divided into 100 sec bins |
 |
|
| Module-wise count rates for Quadrant A Data is divided into 100 sec bins |
 |
 |
| Module-wise count rates for Quadrant B Data is divided into 100 sec bins |
 |
 |
| Module-wise count rates for Quadrant C Data is divided into 100 sec bins |
 |
 |
| Module-wise count rates for Quadrant D Data is divided into 100 sec bins |
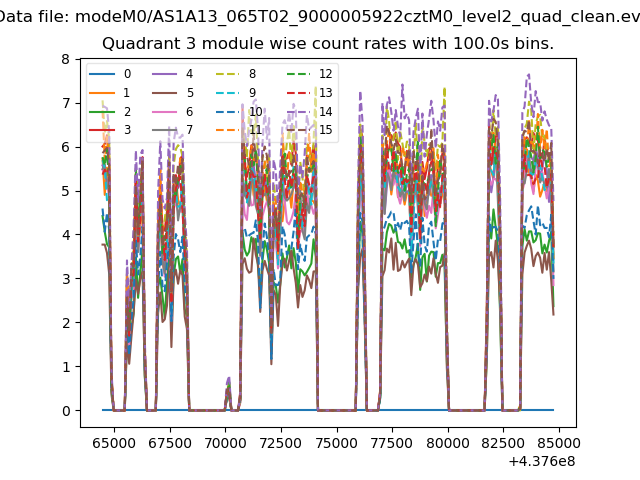 |
 |
| Parameter | Plot |
|---|---|
| CZT HV Monitor |  |
| D_VDD |  |
| Temperature 1 | 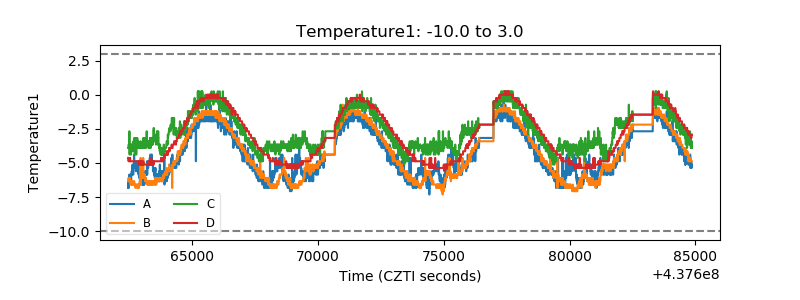 |
| Veto HV Monitor | 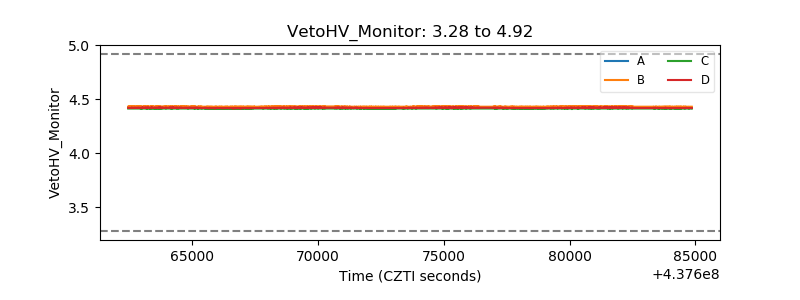 |
| Veto LLD |  |
| Alpha Counter |  |
| _CPM_Rate |  |
| CZT Counter | 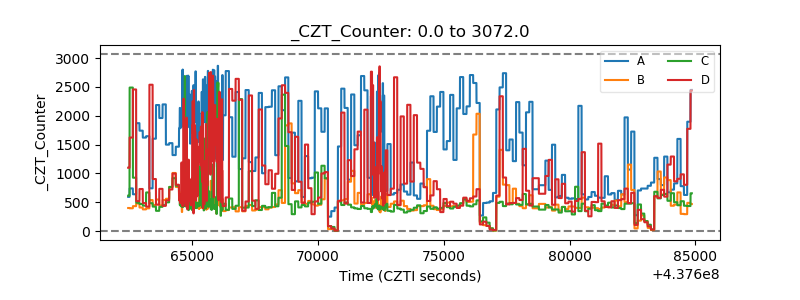 |
| +2.5 Volts monitor |  |
| +5 Volts monitor | 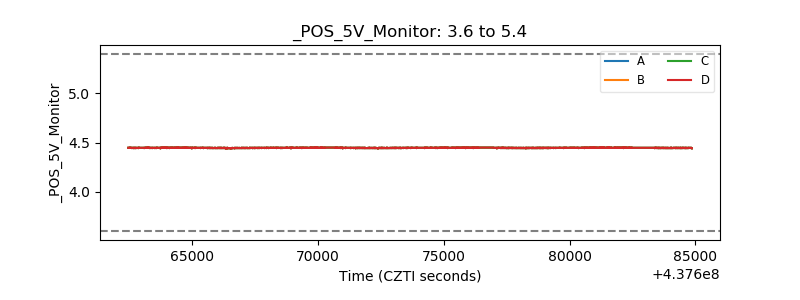 |
| _ROLL_ROT |  |
| _Roll_DEC |  |
| _Roll_RA | 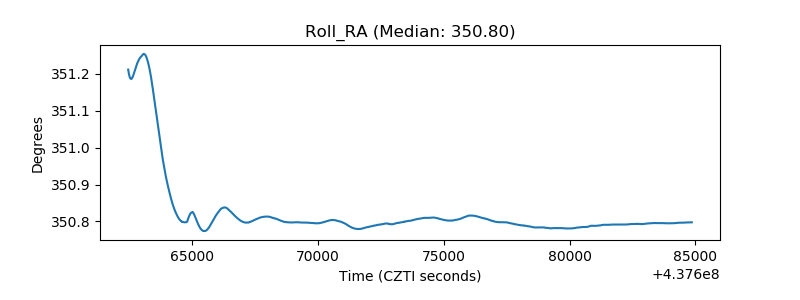 |
| Veto Counter |  |