| Param | Original file | Final file |
|---|---|---|
| Filename | modeM0/AS1A13_025T01_9000005920cztM0_level2.fits | modeM0/AS1A13_025T01_9000005920cztM0_level2_quad_clean.evt |
| Size (bytes) | 675,152,640 | 631,612,800 |
| Size | 643.9 MB | 602.4 MB |
| Events in quadrant A | 3,920,948 | 3,598,599 |
| Events in quadrant B | 3,875,572 | 3,643,029 |
| Events in quadrant C | 4,002,480 | 3,528,705 |
| Events in quadrant D | 3,379,056 | 3,093,137 |
| Mode M9 | |||
|---|---|---|---|
| Quadrant | BADHDUFLAG | Total packets | Discarded packets |
| A | 0 | 94 | 0 |
| B | 0 | 94 | 0 |
| C | 0 | 94 | 0 |
| D | 0 | 94 | 0 |
| Mode SS | |||
|---|---|---|---|
| Quadrant | BADHDUFLAG | Total packets | Discarded packets |
| A | 0 | 1556 | 0 |
| B | 0 | 1556 | 0 |
| C | 0 | 1556 | 0 |
| D | 0 | 1556 | 0 |
| Mode M0 | |||
|---|---|---|---|
| Quadrant | BADHDUFLAG | Total packets | Discarded packets |
| A | 0 | 263716 | 0 |
| B | 0 | 178720 | 0 |
| C | 0 | 177470 | 0 |
| D | 0 | 210276 | 0 |
| Quadrant | Total seconds | Saturated seconds | Saturation percentage |
|---|---|---|---|
| A | 76765 | 5413 | 7.051391% |
| B | 76765 | 2485 | 3.237152% |
| C | 76765 | 1747 | 2.275777% |
| D | 76765 | 3812 | 4.965805% |
Noise dominated data is calculated using 1-second bins in cleaned event files. If a bin has >2000 counts, and if more than 50% of those come from <1% of pixels, then it is considered to be noise-dominated and hence unusable.
| Quadrant | # 1 sec bins | Bins with >0 counts | Bins with >2000 counts | High rate bins dominated by noise | Noise dominated (total time) | Noise dominated (detector-on time) | Marked lightcurve |
|---|---|---|---|---|---|---|---|
| A | 86191 | 76751 | 0 | 0 | 0.00% | 0.00% |  |
| B | 86191 | 76745 | 0 | 0 | 0.00% | 0.00% | 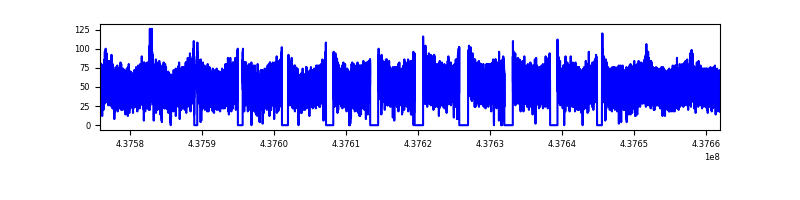 |
| C | 86190 | 76744 | 0 | 0 | 0.00% | 0.00% |  |
| D | 86191 | 76732 | 0 | 0 | 0.00% | 0.00% |  |
Top three noisy pixels from each quadrant. If the there are fewer than three noisy pixels in the level2.evt file, extra rows are filled as -1
| Pixel properties | Quadrant properties | ||||||
|---|---|---|---|---|---|---|---|
| Quadrant | DetID | PixID | Counts | Sigma | Mean | Median | Sigma |
| A | 7 | 110 | 3259 | 8.81 | 1024 | 959 | 261.1 |
| A | 0 | 29 | 3153 | 8.4 | 1024 | 959 | 261.1 |
| A | 7 | 109 | 3013 | 7.87 | 1024 | 959 | 261.1 |
| B | 2 | 9 | 3495 | 12.34 | 1027 | 973 | 204.3 |
| B | 3 | 17 | 2907 | 9.46 | 1027 | 973 | 204.3 |
| B | 2 | 8 | 2740 | 8.65 | 1027 | 973 | 204.3 |
| C | 1 | 81 | 3164 | 8.03 | 1059 | 984 | 271.5 |
| C | 3 | 202 | 3140 | 7.94 | 1059 | 984 | 271.5 |
| C | 1 | 80 | 3096 | 7.78 | 1059 | 984 | 271.5 |
| D | 6 | 38 | 2511 | 6.05 | 973 | 882 | 269.2 |
| D | 10 | 189 | 2481 | 5.94 | 973 | 882 | 269.2 |
| D | 3 | 14 | 2475 | 5.92 | 973 | 882 | 269.2 |
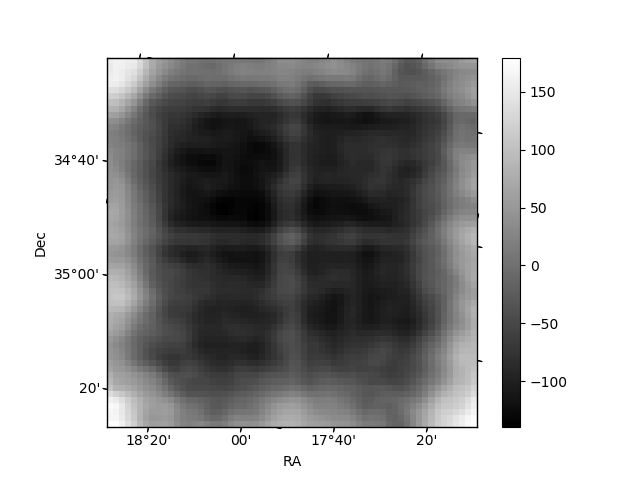
Histogram calculated using DETX and DETY for each event in the final _common_clean file
| Quadrant A |  |
 |
Quadrant B |
|---|---|---|---|
| Quadrant D | 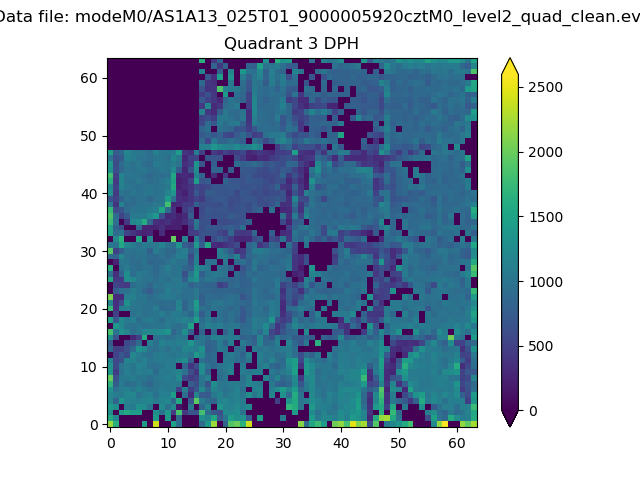 |
 |
Quadrant C |
| Plot type | Count rate plots | Images |
|---|---|---|
| Comparison with Poisson distribution Blue bars denote a histogram of data divided into 1 sec bins. Red curve is a Poisson curve with rate = median count rate of data. |
 |
 |
| Quadrant-wise count rates Data is divided into 100 sec bins |
 |
|
| Module-wise count rates for Quadrant A Data is divided into 100 sec bins |
 |
 |
| Module-wise count rates for Quadrant B Data is divided into 100 sec bins |
 |
 |
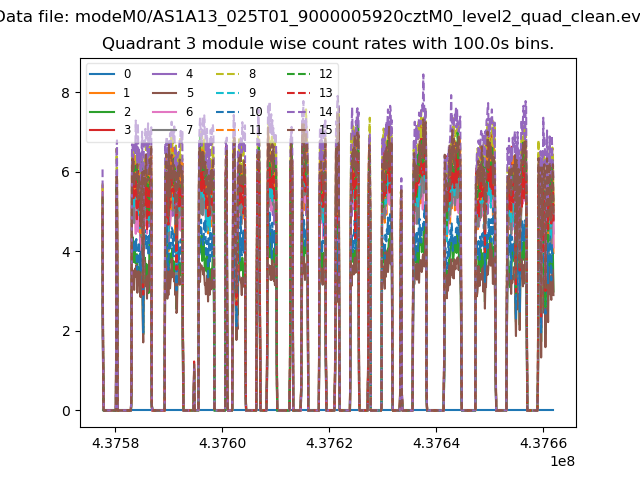
| Module-wise count rates for Quadrant C Data is divided into 100 sec bins |
 |
 |
| Module-wise count rates for Quadrant D Data is divided into 100 sec bins |
 |
 |
| Parameter | Plot |
|---|---|
| CZT HV Monitor | 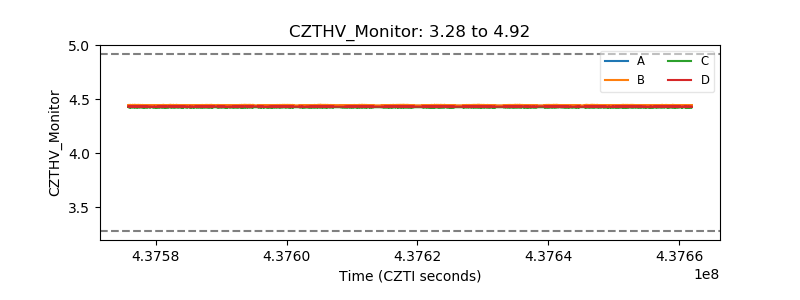 |
| D_VDD |  |
| Temperature 1 |  |
| Veto HV Monitor |  |
| Veto LLD | 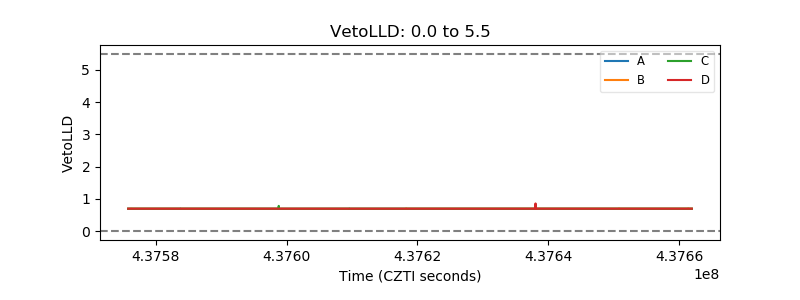 |
| Alpha Counter |  |
| _CPM_Rate |  |
| CZT Counter | 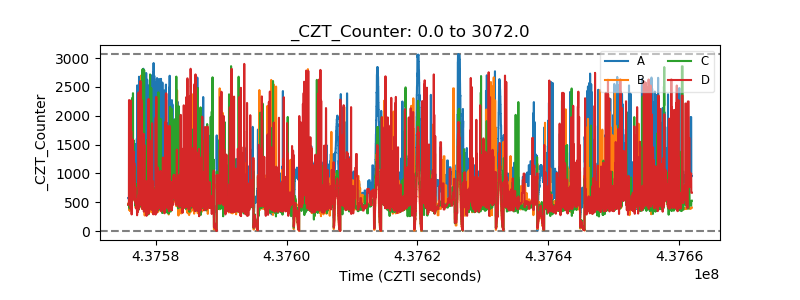 |
| +2.5 Volts monitor |  |
| +5 Volts monitor |  |
| _ROLL_ROT |  |
| _Roll_DEC |  |
| _Roll_RA |  |
| Veto Counter | 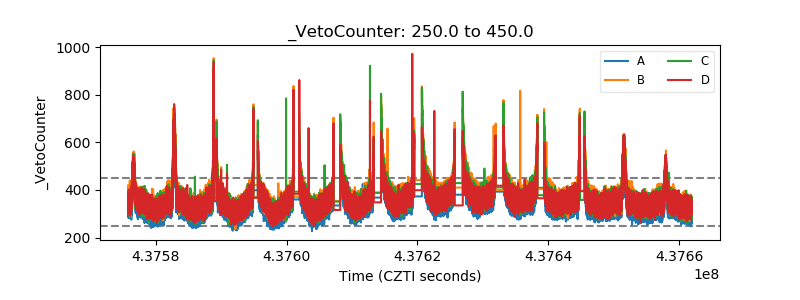 |