| Param | Original file | Final file |
|---|---|---|
| Filename | modeM0/AS1A13_023T01_9000005916cztM0_level2.fits | modeM0/AS1A13_023T01_9000005916cztM0_level2_quad_clean.evt |
| Size (bytes) | 375,721,920 | 339,586,560 |
| Size | 358.3 MB | 323.9 MB |
| Events in quadrant A | 2,213,444 | 1,902,184 |
| Events in quadrant B | 2,183,466 | 1,971,047 |
| Events in quadrant C | 2,268,674 | 1,914,066 |
| Events in quadrant D | 1,908,282 | 1,692,973 |
| Mode SS | |||
|---|---|---|---|
| Quadrant | BADHDUFLAG | Total packets | Discarded packets |
| A | 0 | 828 | 0 |
| B | 0 | 828 | 0 |
| C | 0 | 828 | 0 |
| D | 0 | 828 | 0 |
| Mode M9 | |||
|---|---|---|---|
| Quadrant | BADHDUFLAG | Total packets | Discarded packets |
| A | 0 | 65 | 0 |
| B | 0 | 65 | 0 |
| C | 0 | 65 | 0 |
| D | 0 | 65 | 0 |
| Mode M0 | |||
|---|---|---|---|
| Quadrant | BADHDUFLAG | Total packets | Discarded packets |
| A | 0 | 134885 | 0 |
| B | 0 | 95174 | 0 |
| C | 0 | 86269 | 0 |
| D | 0 | 105321 | 0 |
| Quadrant | Total seconds | Saturated seconds | Saturation percentage |
|---|---|---|---|
| A | 40822 | 1881 | 4.607810% |
| B | 40822 | 1305 | 3.196806% |
| C | 40822 | 538 | 1.317917% |
| D | 40822 | 1662 | 4.071334% |
Noise dominated data is calculated using 1-second bins in cleaned event files. If a bin has >2000 counts, and if more than 50% of those come from <1% of pixels, then it is considered to be noise-dominated and hence unusable.
| Quadrant | # 1 sec bins | Bins with >0 counts | Bins with >2000 counts | High rate bins dominated by noise | Noise dominated (total time) | Noise dominated (detector-on time) | Marked lightcurve |
|---|---|---|---|---|---|---|---|
| A | 47236 | 40819 | 0 | 0 | 0.00% | 0.00% |  |
| B | 47236 | 40818 | 0 | 0 | 0.00% | 0.00% | 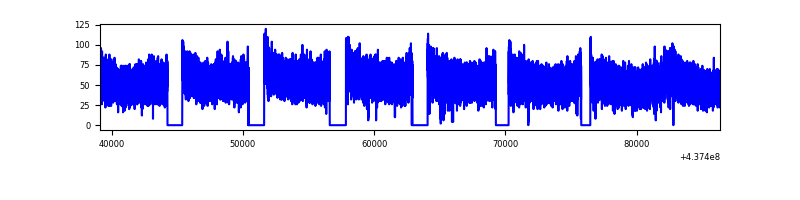 |
| C | 47236 | 40821 | 0 | 0 | 0.00% | 0.00% |  |
| D | 47236 | 40774 | 0 | 0 | 0.00% | 0.00% |  |
Top three noisy pixels from each quadrant. If the there are fewer than three noisy pixels in the level2.evt file, extra rows are filled as -1
| Pixel properties | Quadrant properties | ||||||
|---|---|---|---|---|---|---|---|
| Quadrant | DetID | PixID | Counts | Sigma | Mean | Median | Sigma |
| A | 0 | 29 | 1814 | 8.61 | 577 | 541 | 147.9 |
| A | 7 | 110 | 1791 | 8.45 | 577 | 541 | 147.9 |
| A | 15 | 236 | 1744 | 8.13 | 577 | 541 | 147.9 |
| B | 2 | 9 | 1996 | 12.5 | 577 | 549 | 115.7 |
| B | 2 | 8 | 1630 | 9.34 | 577 | 549 | 115.7 |
| B | 3 | 17 | 1608 | 9.15 | 577 | 549 | 115.7 |
| C | 1 | 81 | 1756 | 7.8 | 600 | 560 | 153.3 |
| C | 1 | 80 | 1722 | 7.58 | 600 | 560 | 153.3 |
| C | 3 | 202 | 1711 | 7.51 | 600 | 560 | 153.3 |
| D | 10 | 189 | 1441 | 6.23 | 549 | 499 | 151.2 |
| D | 3 | 14 | 1403 | 5.98 | 549 | 499 | 151.2 |
| D | 7 | 3 | 1387 | 5.87 | 549 | 499 | 151.2 |
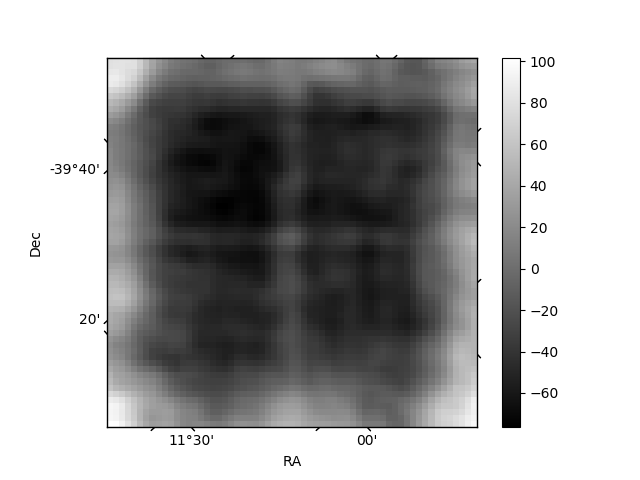
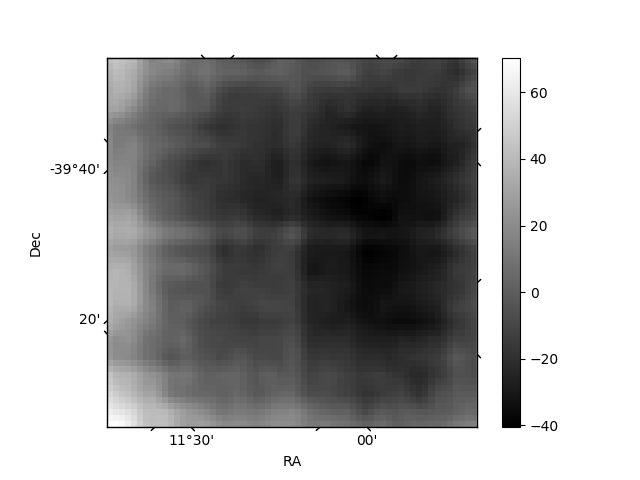
Histogram calculated using DETX and DETY for each event in the final _common_clean file
| Quadrant A |  |
 |
Quadrant B |
|---|---|---|---|
| Quadrant D |  |
 |
Quadrant C |
| Plot type | Count rate plots | Images |
|---|---|---|
| Comparison with Poisson distribution Blue bars denote a histogram of data divided into 1 sec bins. Red curve is a Poisson curve with rate = median count rate of data. |
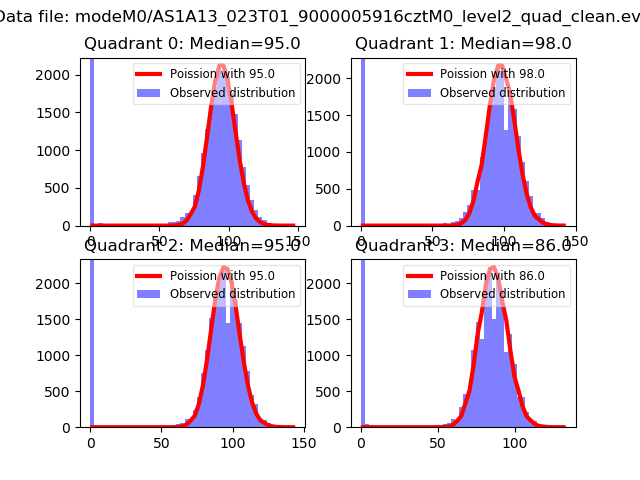 |
 |
| Quadrant-wise count rates Data is divided into 100 sec bins |
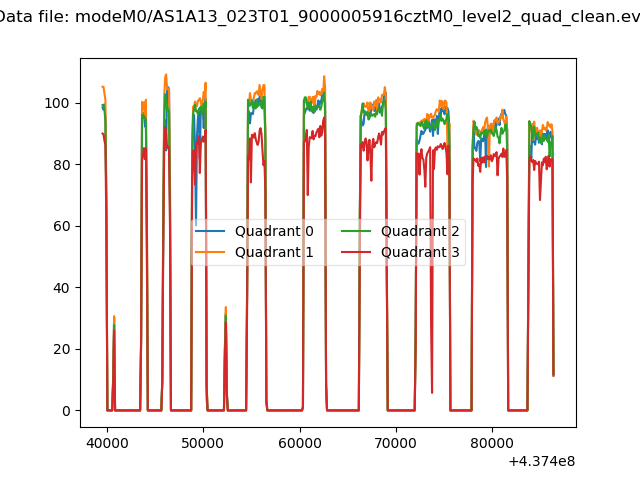 |
|
| Module-wise count rates for Quadrant A Data is divided into 100 sec bins |
 |
 |
| Module-wise count rates for Quadrant B Data is divided into 100 sec bins |
 |
 |
| Module-wise count rates for Quadrant C Data is divided into 100 sec bins |
 |
 |
| Module-wise count rates for Quadrant D Data is divided into 100 sec bins |
 |
 |
| Parameter | Plot |
|---|---|
| CZT HV Monitor |  |
| D_VDD | 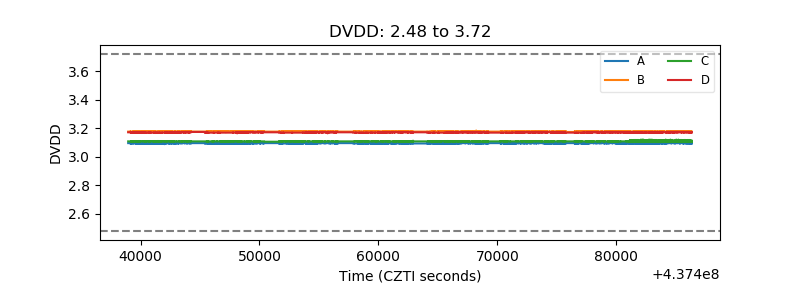 |
| Temperature 1 |  |
| Veto HV Monitor |  |
| Veto LLD | 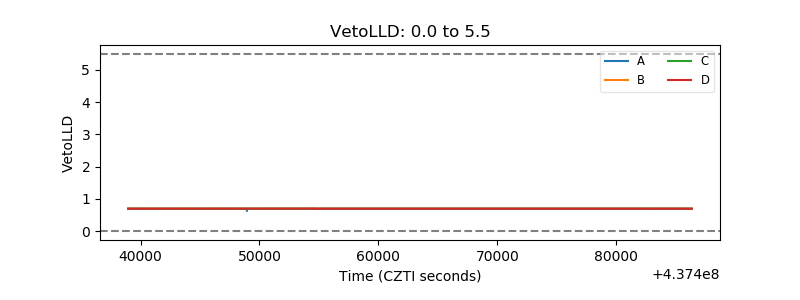 |
| Alpha Counter |  |
| _CPM_Rate |  |
| CZT Counter |  |
| +2.5 Volts monitor |  |
| +5 Volts monitor |  |
| _ROLL_ROT |  |
| _Roll_DEC |  |
| _Roll_RA |  |
| Veto Counter |  |