| Param | Original file | Final file |
|---|---|---|
| Filename | modeM0/AS1A13_087T01_9000005908cztM0_level2.fits | modeM0/AS1A13_087T01_9000005908cztM0_level2_quad_clean.evt |
| Size (bytes) | 977,106,240 | 899,288,640 |
| Size | 931.8 MB | 857.6 MB |
| Events in quadrant A | 5,841,244 | 5,139,649 |
| Events in quadrant B | 5,773,238 | 5,440,549 |
| Events in quadrant C | 5,554,078 | 4,801,436 |
| Events in quadrant D | 4,970,280 | 4,412,866 |
| Mode M9 | |||
|---|---|---|---|
| Quadrant | BADHDUFLAG | Total packets | Discarded packets |
| A | 0 | 162 | 0 |
| B | 0 | 162 | 0 |
| C | 0 | 162 | 0 |
| D | 0 | 162 | 0 |
| Mode M0 | |||
|---|---|---|---|
| Quadrant | BADHDUFLAG | Total packets | Discarded packets |
| A | 0 | 304383 | 0 |
| B | 0 | 255401 | 0 |
| C | 0 | 432450 | 0 |
| D | 0 | 307097 | 0 |
| Mode SS | |||
|---|---|---|---|
| Quadrant | BADHDUFLAG | Total packets | Discarded packets |
| A | 0 | 2202 | 0 |
| B | 0 | 2202 | 0 |
| C | 0 | 2202 | 0 |
| D | 0 | 2202 | 0 |
| Quadrant | Total seconds | Saturated seconds | Saturation percentage |
|---|---|---|---|
| A | 108549 | 6721 | 6.191674% |
| B | 108549 | 4385 | 4.039650% |
| C | 108543 | 14425 | 13.289664% |
| D | 108549 | 8155 | 7.512736% |
Noise dominated data is calculated using 1-second bins in cleaned event files. If a bin has >2000 counts, and if more than 50% of those come from <1% of pixels, then it is considered to be noise-dominated and hence unusable.
| Quadrant | # 1 sec bins | Bins with >0 counts | Bins with >2000 counts | High rate bins dominated by noise | Noise dominated (total time) | Noise dominated (detector-on time) | Marked lightcurve |
|---|---|---|---|---|---|---|---|
| A | 124620 | 108491 | 0 | 0 | 0.00% | 0.00% |  |
| B | 124619 | 108510 | 0 | 0 | 0.00% | 0.00% |  |
| C | 124619 | 108436 | 0 | 0 | 0.00% | 0.00% |  |
| D | 124619 | 108348 | 0 | 0 | 0.00% | 0.00% |  |
Top three noisy pixels from each quadrant. If the there are fewer than three noisy pixels in the level2.evt file, extra rows are filled as -1
| Pixel properties | Quadrant properties | ||||||
|---|---|---|---|---|---|---|---|
| Quadrant | DetID | PixID | Counts | Sigma | Mean | Median | Sigma |
| A | 7 | 110 | 4768 | 8.72 | 1524 | 1425 | 383.3 |
| A | 15 | 236 | 4648 | 8.41 | 1524 | 1425 | 383.3 |
| A | 0 | 29 | 4620 | 8.34 | 1524 | 1425 | 383.3 |
| B | 2 | 9 | 5242 | 12.43 | 1523 | 1446 | 305.3 |
| B | 2 | 8 | 4131 | 8.8 | 1523 | 1446 | 305.3 |
| B | 3 | 17 | 4045 | 8.51 | 1523 | 1446 | 305.3 |
| C | 1 | 81 | 4213 | 7.41 | 1473 | 1371 | 383.4 |
| C | 1 | 80 | 4188 | 7.35 | 1473 | 1371 | 383.4 |
| C | 3 | 202 | 4070 | 7.04 | 1473 | 1371 | 383.4 |
| D | 7 | 3 | 3581 | 5.78 | 1433 | 1302 | 394.3 |
| D | 6 | 67 | 3559 | 5.72 | 1433 | 1302 | 394.3 |
| D | 10 | 113 | 3547 | 5.69 | 1433 | 1302 | 394.3 |
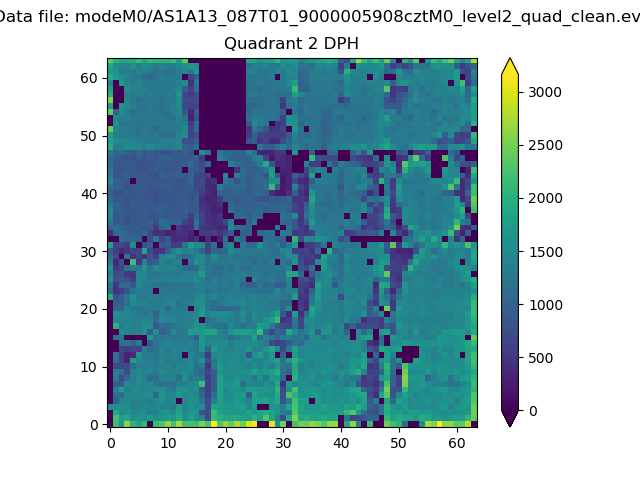
Histogram calculated using DETX and DETY for each event in the final _common_clean file
| Quadrant A |  |
 |
Quadrant B |
|---|---|---|---|
| Quadrant D |  |
 |
Quadrant C |
| Plot type | Count rate plots | Images |
|---|---|---|
| Comparison with Poisson distribution Blue bars denote a histogram of data divided into 1 sec bins. Red curve is a Poisson curve with rate = median count rate of data. |
 |
 |
| Quadrant-wise count rates Data is divided into 100 sec bins |
 |
|
| Module-wise count rates for Quadrant A Data is divided into 100 sec bins |
 |
 |
| Module-wise count rates for Quadrant B Data is divided into 100 sec bins |
 |
 |
| Module-wise count rates for Quadrant C Data is divided into 100 sec bins |
 |
 |
| Module-wise count rates for Quadrant D Data is divided into 100 sec bins |
 |
 |
| Parameter | Plot |
|---|---|
| CZT HV Monitor |  |
| D_VDD |  |
| Temperature 1 |  |
| Veto HV Monitor |  |
| Veto LLD | 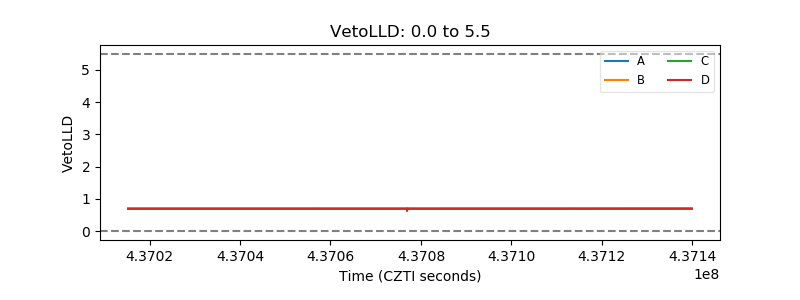 |
| Alpha Counter |  |
| _CPM_Rate |  |
| CZT Counter |  |
| +2.5 Volts monitor |  |
| +5 Volts monitor |  |
| _ROLL_ROT | 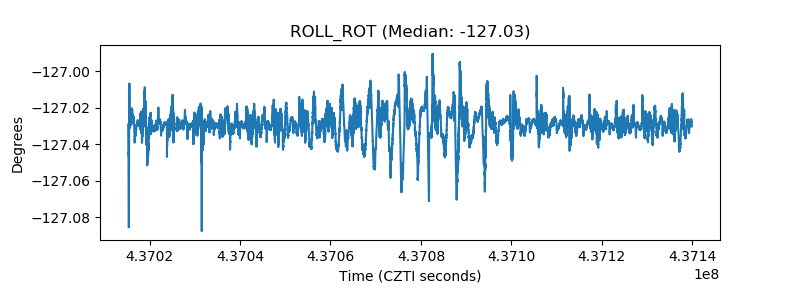 |
| _Roll_DEC |  |
| _Roll_RA |  |
| Veto Counter |  |