| Param | Original file | Final file |
|---|---|---|
| Filename | modeM0/AS1A13_018T01_9000005906cztM0_level2.fits | modeM0/AS1A13_018T01_9000005906cztM0_level2_quad_clean.evt |
| Size (bytes) | 2,788,954,560 | 2,822,857,920 |
| Size | 2.6 GB | 2.6 GB |
| Events in quadrant A | 16,806,320 | 17,342,116 |
| Events in quadrant B | 16,706,768 | 18,113,165 |
| Events in quadrant C | 15,723,352 | 15,037,324 |
| Events in quadrant D | 13,285,002 | 13,130,452 |
| Mode M0 | |||
|---|---|---|---|
| Quadrant | BADHDUFLAG | Total packets | Discarded packets |
| A | 0 | 1045082 | 0 |
| B | 0 | 836667 | 0 |
| C | 0 | 1298545 | 0 |
| D | 0 | 1296213 | 0 |
| Mode SS | |||
|---|---|---|---|
| Quadrant | BADHDUFLAG | Total packets | Discarded packets |
| A | 0 | 6475 | 0 |
| B | 0 | 6478 | 0 |
| C | 0 | 6478 | 0 |
| D | 0 | 6478 | 0 |
| Mode M9 | |||
|---|---|---|---|
| Quadrant | BADHDUFLAG | Total packets | Discarded packets |
| A | 0 | 388 | 0 |
| B | 0 | 388 | 0 |
| C | 0 | 388 | 0 |
| D | 0 | 388 | 0 |
| Quadrant | Total seconds | Saturated seconds | Saturation percentage |
|---|---|---|---|
| A | 319225 | 30543 | 9.567860% |
| B | 319239 | 16661 | 5.218974% |
| C | 319142 | 64030 | 20.063169% |
| D | 319219 | 65382 | 20.481864% |
Noise dominated data is calculated using 1-second bins in cleaned event files. If a bin has >2000 counts, and if more than 50% of those come from <1% of pixels, then it is considered to be noise-dominated and hence unusable.
| Quadrant | # 1 sec bins | Bins with >0 counts | Bins with >2000 counts | High rate bins dominated by noise | Noise dominated (total time) | Noise dominated (detector-on time) | Marked lightcurve |
|---|---|---|---|---|---|---|---|
| A | 362889 | 318945 | 0 | 0 | 0.00% | 0.00% |  |
| B | 362888 | 319131 | 0 | 0 | 0.00% | 0.00% |  |
| C | 362888 | 318445 | 0 | 0 | 0.00% | 0.00% |  |
| D | 362888 | 318076 | 0 | 0 | 0.00% | 0.00% |  |
Top three noisy pixels from each quadrant. If the there are fewer than three noisy pixels in the level2.evt file, extra rows are filled as -1
| Pixel properties | Quadrant properties | ||||||
|---|---|---|---|---|---|---|---|
| Quadrant | DetID | PixID | Counts | Sigma | Mean | Median | Sigma |
| A | 7 | 110 | 13913 | 8.93 | 4401 | 4116 | 1097.2 |
| A | 0 | 29 | 13695 | 8.73 | 4401 | 4116 | 1097.2 |
| A | 0 | 30 | 12785 | 7.9 | 4401 | 4116 | 1097.2 |
| B | 2 | 9 | 14989 | 12.38 | 4426 | 4203 | 871.3 |
| B | 3 | 17 | 12106 | 9.07 | 4426 | 4203 | 871.3 |
| B | 2 | 8 | 11850 | 8.78 | 4426 | 4203 | 871.3 |
| C | 1 | 81 | 12116 | 7.73 | 4168 | 3879 | 1065.5 |
| C | 3 | 202 | 11993 | 7.62 | 4168 | 3879 | 1065.5 |
| C | 1 | 80 | 11987 | 7.61 | 4168 | 3879 | 1065.5 |
| D | 7 | 3 | 9827 | 5.96 | 3846 | 3484 | 1064.5 |
| D | 10 | 189 | 9801 | 5.93 | 3846 | 3484 | 1064.5 |
| D | 6 | 67 | 9729 | 5.87 | 3846 | 3484 | 1064.5 |
Histogram calculated using DETX and DETY for each event in the final _common_clean file
| Quadrant A | 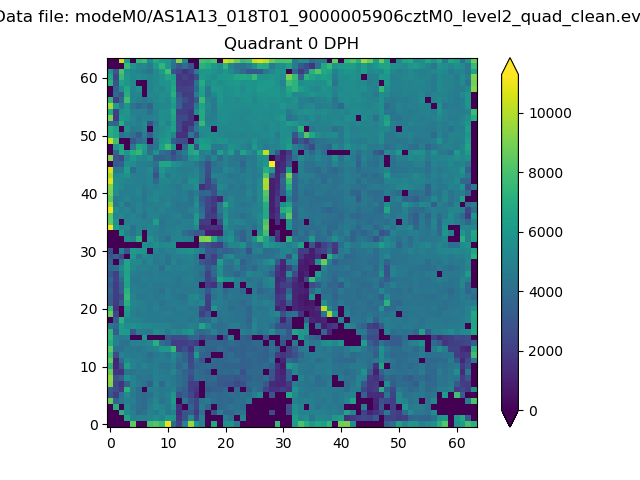 |
 |
Quadrant B |
|---|---|---|---|
| Quadrant D | 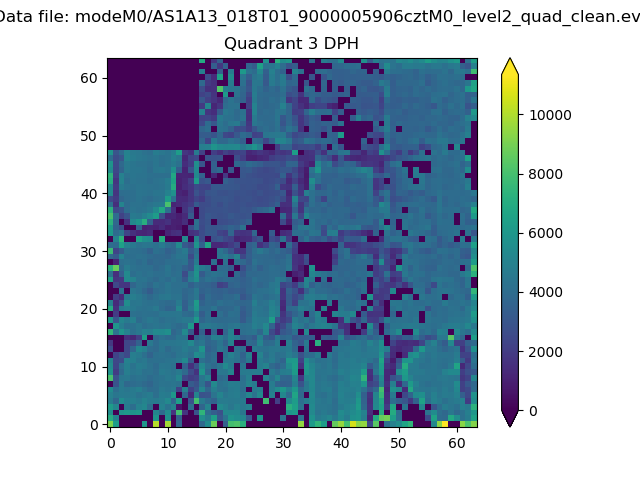 |
 |
Quadrant C |
| Plot type | Count rate plots | Images |
|---|---|---|
| Comparison with Poisson distribution Blue bars denote a histogram of data divided into 1 sec bins. Red curve is a Poisson curve with rate = median count rate of data. |
 |
 |
| Quadrant-wise count rates Data is divided into 100 sec bins |
 |
|
| Module-wise count rates for Quadrant A Data is divided into 100 sec bins |
 |
 |
| Module-wise count rates for Quadrant B Data is divided into 100 sec bins |
 |
 |
| Module-wise count rates for Quadrant C Data is divided into 100 sec bins |
 |
 |
| Module-wise count rates for Quadrant D Data is divided into 100 sec bins |
 |
 |
| Parameter | Plot |
|---|---|
| CZT HV Monitor |  |
| D_VDD |  |
| Temperature 1 |  |
| Veto HV Monitor |  |
| Veto LLD |  |
| Alpha Counter | 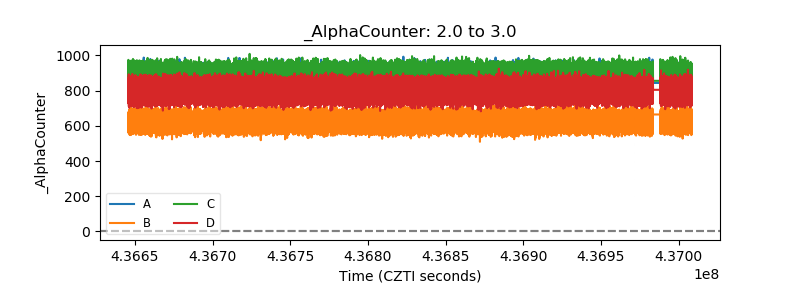 |
| _CPM_Rate |  |
| CZT Counter | 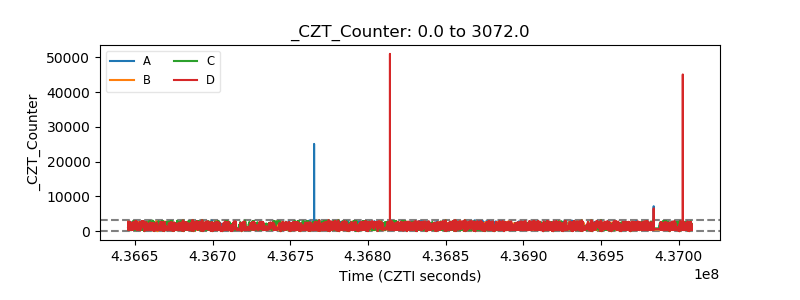 |
| +2.5 Volts monitor |  |
| +5 Volts monitor | 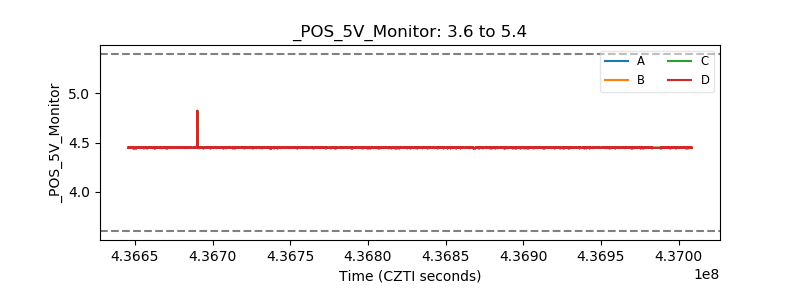 |
| _ROLL_ROT |  |
| _Roll_DEC |  |
| _Roll_RA |  |
| Veto Counter |  |