| Param | Original file | Final file |
|---|---|---|
| Filename | modeM0/AS1A13_003T01_9000005902cztM0_level2.fits | modeM0/AS1A13_003T01_9000005902cztM0_level2_quad_clean.evt |
| Size (bytes) | 1,697,667,840 | 1,752,606,720 |
| Size | 1.6 GB | 1.6 GB |
| Events in quadrant A | 10,264,242 | 10,868,125 |
| Events in quadrant B | 10,028,436 | 11,087,073 |
| Events in quadrant C | 9,679,986 | 9,564,752 |
| Events in quadrant D | 8,077,904 | 8,225,488 |
| Mode SS | |||
|---|---|---|---|
| Quadrant | BADHDUFLAG | Total packets | Discarded packets |
| A | 0 | 3944 | 0 |
| B | 0 | 3944 | 0 |
| C | 0 | 3944 | 0 |
| D | 0 | 3944 | 0 |
| Mode M0 | |||
|---|---|---|---|
| Quadrant | BADHDUFLAG | Total packets | Discarded packets |
| A | 0 | 648295 | 0 |
| B | 0 | 485706 | 0 |
| C | 0 | 615158 | 0 |
| D | 0 | 728256 | 0 |
| Mode M9 | |||
|---|---|---|---|
| Quadrant | BADHDUFLAG | Total packets | Discarded packets |
| A | 0 | 221 | 0 |
| B | 0 | 222 | 0 |
| C | 0 | 222 | 0 |
| D | 0 | 222 | 0 |
| Quadrant | Total seconds | Saturated seconds | Saturation percentage |
|---|---|---|---|
| A | 194589 | 11196 | 5.753665% |
| B | 194604 | 9053 | 4.652011% |
| C | 194571 | 24998 | 12.847752% |
| D | 194590 | 30075 | 15.455573% |
Noise dominated data is calculated using 1-second bins in cleaned event files. If a bin has >2000 counts, and if more than 50% of those come from <1% of pixels, then it is considered to be noise-dominated and hence unusable.
| Quadrant | # 1 sec bins | Bins with >0 counts | Bins with >2000 counts | High rate bins dominated by noise | Noise dominated (total time) | Noise dominated (detector-on time) | Marked lightcurve |
|---|---|---|---|---|---|---|---|
| A | 220975 | 194565 | 0 | 0 | 0.00% | 0.00% |  |
| B | 220975 | 194564 | 0 | 0 | 0.00% | 0.00% | 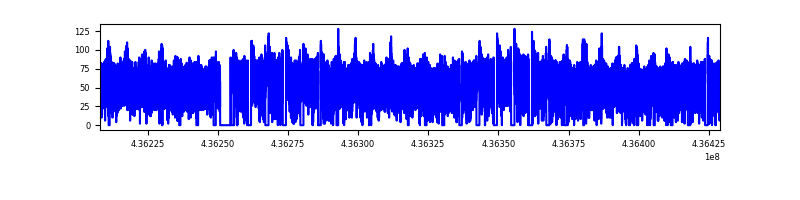 |
| C | 220975 | 193730 | 0 | 0 | 0.00% | 0.00% |  |
| D | 220975 | 193743 | 0 | 0 | 0.00% | 0.00% |  |
Top three noisy pixels from each quadrant. If the there are fewer than three noisy pixels in the level2.evt file, extra rows are filled as -1
| Pixel properties | Quadrant properties | ||||||
|---|---|---|---|---|---|---|---|
| Quadrant | DetID | PixID | Counts | Sigma | Mean | Median | Sigma |
| A | 0 | 29 | 8349 | 8.83 | 2679 | 2508 | 661.3 |
| A | 7 | 110 | 8272 | 8.72 | 2679 | 2508 | 661.3 |
| A | 15 | 236 | 8098 | 8.45 | 2679 | 2508 | 661.3 |
| B | 2 | 9 | 8811 | 12.02 | 2656 | 2523 | 523.2 |
| B | 3 | 17 | 7443 | 9.4 | 2656 | 2523 | 523.2 |
| B | 2 | 8 | 7110 | 8.77 | 2656 | 2523 | 523.2 |
| C | 3 | 202 | 7642 | 8.01 | 2564 | 2384 | 656.7 |
| C | 1 | 81 | 7541 | 7.85 | 2564 | 2384 | 656.7 |
| C | 1 | 80 | 7502 | 7.79 | 2564 | 2384 | 656.7 |
| D | 6 | 67 | 6043 | 6.06 | 2350 | 2129 | 646.1 |
| D | 6 | 38 | 5949 | 5.91 | 2350 | 2129 | 646.1 |
| D | 10 | 189 | 5948 | 5.91 | 2350 | 2129 | 646.1 |
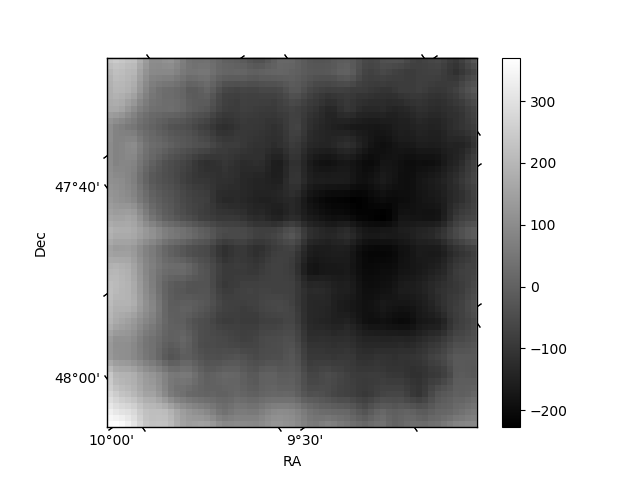
Histogram calculated using DETX and DETY for each event in the final _common_clean file
| Quadrant A | 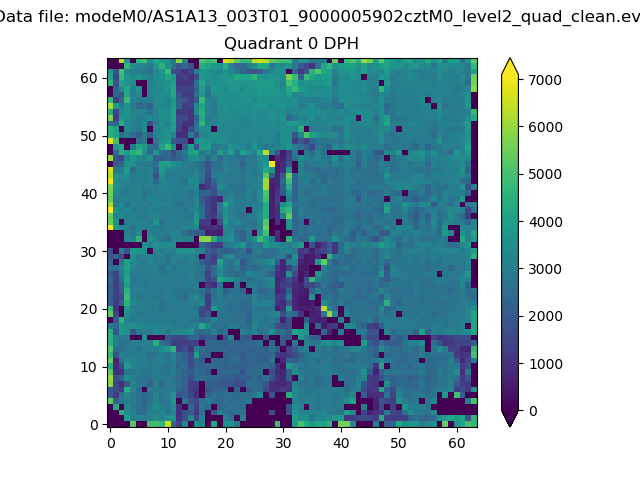 |
 |
Quadrant B |
|---|---|---|---|
| Quadrant D |  |
 |
Quadrant C |
| Plot type | Count rate plots | Images |
|---|---|---|
| Comparison with Poisson distribution Blue bars denote a histogram of data divided into 1 sec bins. Red curve is a Poisson curve with rate = median count rate of data. |
 |
 |
| Quadrant-wise count rates Data is divided into 100 sec bins |
 |
|
| Module-wise count rates for Quadrant A Data is divided into 100 sec bins |
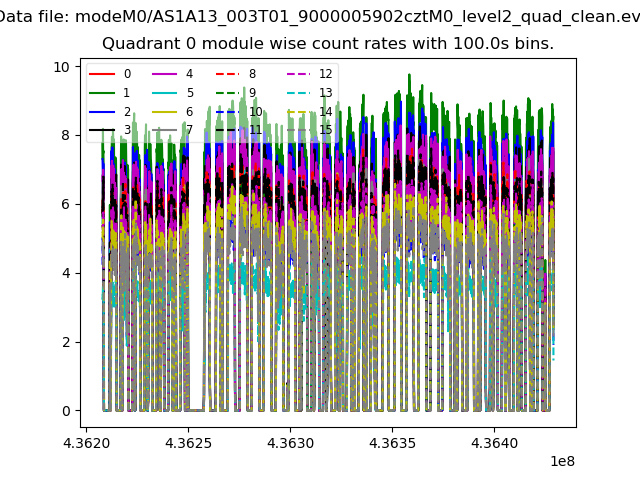 |
 |
| Module-wise count rates for Quadrant B Data is divided into 100 sec bins |
 |
 |
| Module-wise count rates for Quadrant C Data is divided into 100 sec bins |
 |
 |
| Module-wise count rates for Quadrant D Data is divided into 100 sec bins |
 |
 |
| Parameter | Plot |
|---|---|
| CZT HV Monitor | 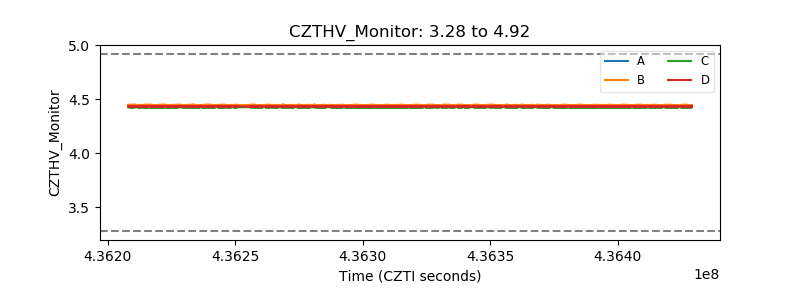 |
| D_VDD |  |
| Temperature 1 |  |
| Veto HV Monitor | 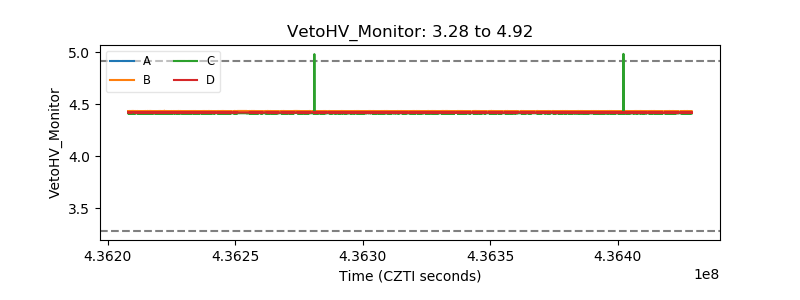 |
| Veto LLD |  |
| Alpha Counter |  |
| _CPM_Rate |  |
| CZT Counter | 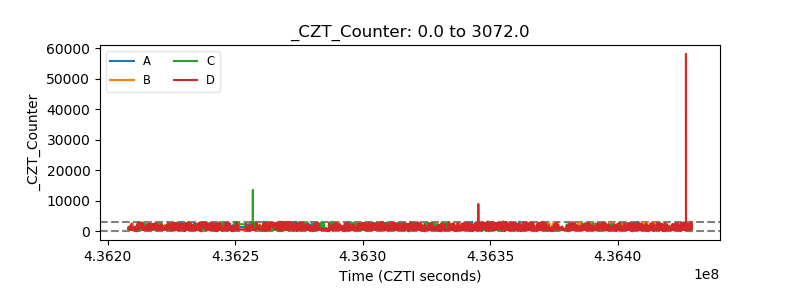 |
| +2.5 Volts monitor |  |
| +5 Volts monitor |  |
| _ROLL_ROT | 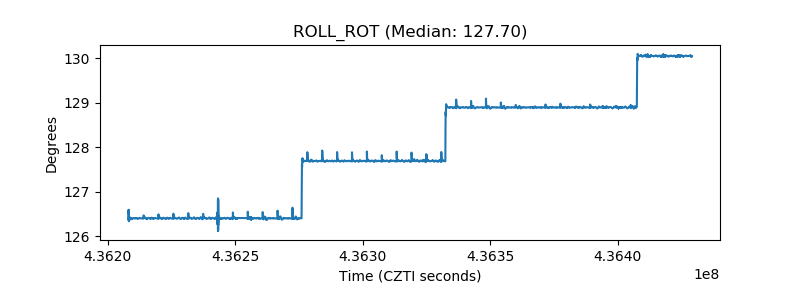 |
| _Roll_DEC |  |
| _Roll_RA |  |
| Veto Counter |  |