| Param | Original file | Final file |
|---|---|---|
| Filename | modeM0/AS1A12_018T01_9000005896cztM0_level2.fits | modeM0/AS1A12_018T01_9000005896cztM0_level2_quad_clean.evt |
| Size (bytes) | 838,465,920 | 908,916,480 |
| Size | 799.6 MB | 866.8 MB |
| Events in quadrant A | 5,450,424 | 6,511,544 |
| Events in quadrant B | 5,616,282 | 7,165,519 |
| Events in quadrant C | 2,639,112 | 1,804,960 |
| Events in quadrant D | 4,023,668 | 4,441,909 |
| Mode SS | |||
|---|---|---|---|
| Quadrant | BADHDUFLAG | Total packets | Discarded packets |
| A | 0 | 2246 | 0 |
| B | 0 | 2246 | 0 |
| C | 0 | 2246 | 0 |
| D | 0 | 2246 | 0 |
| Mode M0 | |||
|---|---|---|---|
| Quadrant | BADHDUFLAG | Total packets | Discarded packets |
| A | 0 | 540961 | 0 |
| B | 0 | 269734 | 0 |
| C | 0 | 821798 | 0 |
| D | 0 | 529394 | 0 |
| Mode M9 | |||
|---|---|---|---|
| Quadrant | BADHDUFLAG | Total packets | Discarded packets |
| A | 0 | 128 | 0 |
| B | 0 | 128 | 0 |
| C | 0 | 128 | 0 |
| D | 0 | 128 | 0 |
| Quadrant | Total seconds | Saturated seconds | Saturation percentage |
|---|---|---|---|
| A | 110858 | 14264 | 12.866911% |
| B | 110858 | 3124 | 2.818019% |
| C | 110857 | 87100 | 78.569689% |
| D | 110857 | 33869 | 30.551972% |
Noise dominated data is calculated using 1-second bins in cleaned event files. If a bin has >2000 counts, and if more than 50% of those come from <1% of pixels, then it is considered to be noise-dominated and hence unusable.
| Quadrant | # 1 sec bins | Bins with >0 counts | Bins with >2000 counts | High rate bins dominated by noise | Noise dominated (total time) | Noise dominated (detector-on time) | Marked lightcurve |
|---|---|---|---|---|---|---|---|
| A | 127385 | 110855 | 0 | 0 | 0.00% | 0.00% |  |
| B | 127385 | 110851 | 0 | 0 | 0.00% | 0.00% |  |
| C | 127385 | 106716 | 0 | 0 | 0.00% | 0.00% |  |
| D | 127385 | 109069 | 0 | 0 | 0.00% | 0.00% |  |
Top three noisy pixels from each quadrant. If the there are fewer than three noisy pixels in the level2.evt file, extra rows are filled as -1
| Pixel properties | Quadrant properties | ||||||
|---|---|---|---|---|---|---|---|
| Quadrant | DetID | PixID | Counts | Sigma | Mean | Median | Sigma |
| A | 7 | 110 | 4552 | 9.19 | 1428 | 1344 | 348.9 |
| A | 0 | 29 | 4445 | 8.89 | 1428 | 1344 | 348.9 |
| A | 0 | 30 | 4288 | 8.44 | 1428 | 1344 | 348.9 |
| B | 2 | 9 | 5099 | 12.6 | 1492 | 1422 | 291.9 |
| B | 3 | 17 | 4102 | 9.18 | 1492 | 1422 | 291.9 |
| B | 2 | 8 | 4067 | 9.06 | 1492 | 1422 | 291.9 |
| C | 3 | 202 | 2124 | 8.29 | 700 | 655 | 177.1 |
| C | 3 | 203 | 2031 | 7.77 | 700 | 655 | 177.1 |
| C | 12 | 241 | 1809 | 6.52 | 700 | 655 | 177.1 |
| D | 10 | 189 | 3000 | 6.05 | 1173 | 1067 | 319.5 |
| D | 7 | 3 | 2999 | 6.05 | 1173 | 1067 | 319.5 |
| D | 6 | 67 | 2955 | 5.91 | 1173 | 1067 | 319.5 |
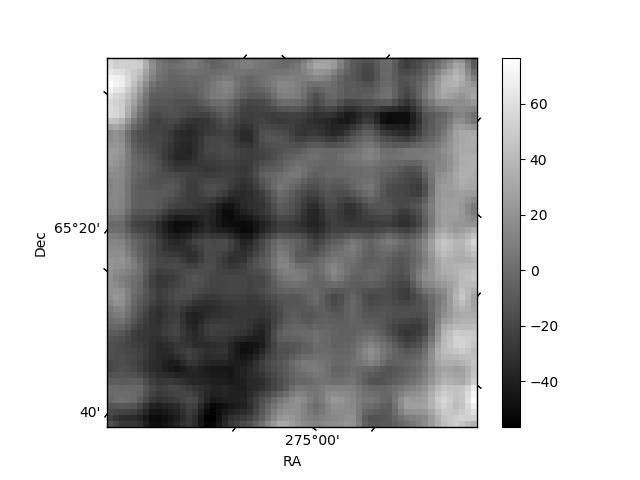
Histogram calculated using DETX and DETY for each event in the final _common_clean file
| Quadrant A | 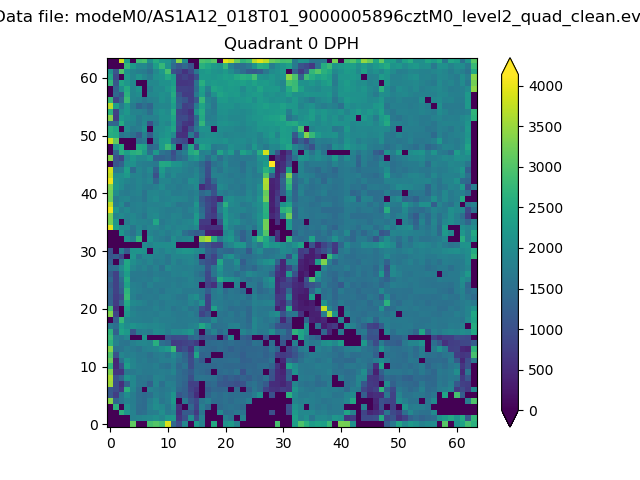 |
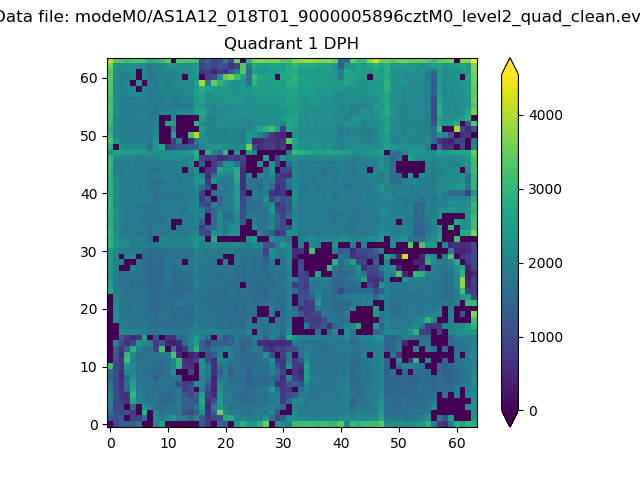 |
Quadrant B |
|---|---|---|---|
| Quadrant D |  |
 |
Quadrant C |
| Plot type | Count rate plots | Images |
|---|---|---|
| Comparison with Poisson distribution Blue bars denote a histogram of data divided into 1 sec bins. Red curve is a Poisson curve with rate = median count rate of data. |
 |
 |
| Quadrant-wise count rates Data is divided into 100 sec bins |
 |
|
| Module-wise count rates for Quadrant A Data is divided into 100 sec bins |
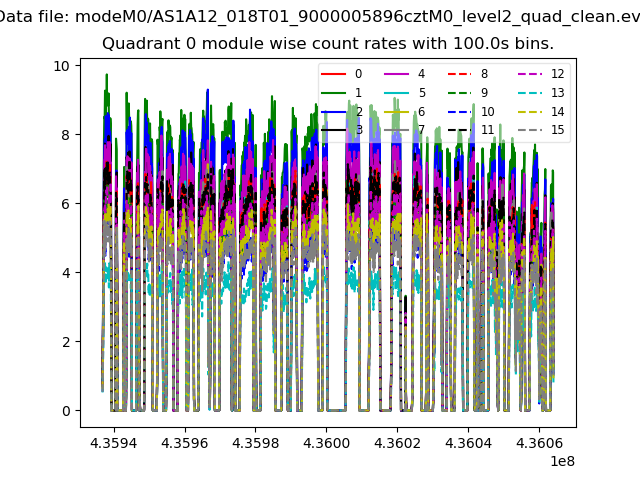 |
 |
| Module-wise count rates for Quadrant B Data is divided into 100 sec bins |
 |
 |
| Module-wise count rates for Quadrant C Data is divided into 100 sec bins |
 |
 |
| Module-wise count rates for Quadrant D Data is divided into 100 sec bins |
 |
 |
| Parameter | Plot |
|---|---|
| CZT HV Monitor | 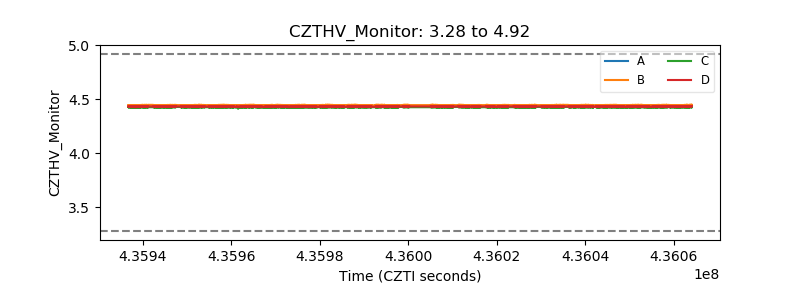 |
| D_VDD |  |
| Temperature 1 |  |
| Veto HV Monitor |  |
| Veto LLD |  |
| Alpha Counter |  |
| _CPM_Rate | 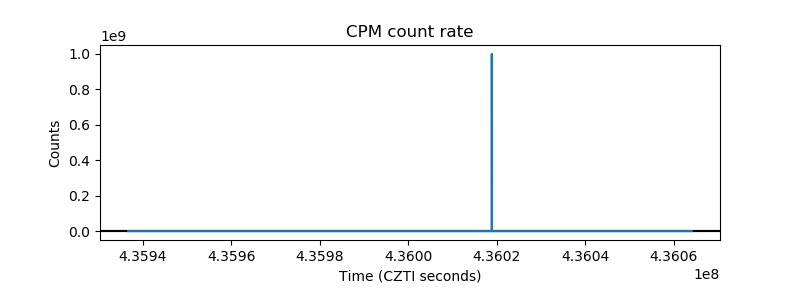 |
| CZT Counter |  |
| +2.5 Volts monitor | 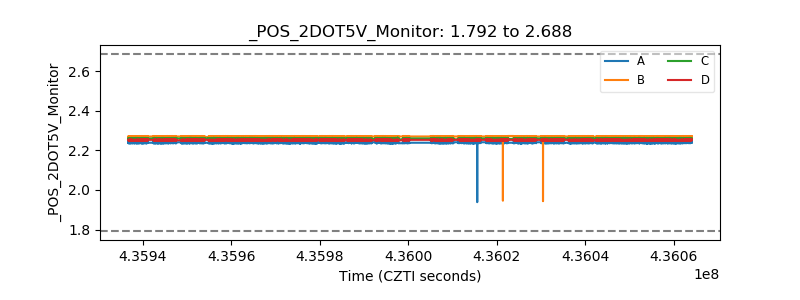 |
| +5 Volts monitor |  |
| _ROLL_ROT |  |
| _Roll_DEC |  |
| _Roll_RA | 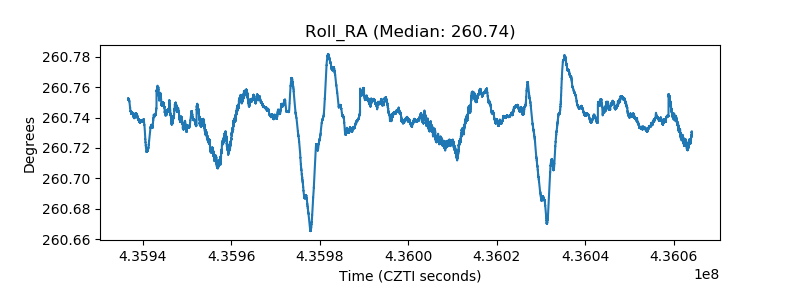 |
| Veto Counter |  |