| Param | Original file | Final file |
|---|---|---|
| Filename | modeM0/AS1A10_094T37_9000005884cztM0_level2.fits | modeM0/AS1A10_094T37_9000005884cztM0_level2_quad_clean.evt |
| Size (bytes) | 46,123,200 | 62,942,400 |
| Size | 44.0 MB | 60.0 MB |
| Events in quadrant A | 362,770 | 659,100 |
| Events in quadrant B | 363,994 | 680,712 |
| Events in quadrant C | 96,382 | 41,674 |
| Events in quadrant D | 45,220 | 2,434 |
| Mode M9 | |||
|---|---|---|---|
| Quadrant | BADHDUFLAG | Total packets | Discarded packets |
| A | 0 | 3 | 0 |
| B | 0 | 3 | 0 |
| C | 0 | 3 | 0 |
| D | 0 | 3 | 0 |
| Mode M0 | |||
|---|---|---|---|
| Quadrant | BADHDUFLAG | Total packets | Discarded packets |
| A | 0 | 26096 | 0 |
| B | 0 | 19379 | 0 |
| C | 0 | 63757 | 0 |
| D | 0 | 49070 | 0 |
| Mode SS | |||
|---|---|---|---|
| Quadrant | BADHDUFLAG | Total packets | Discarded packets |
| A | 0 | 152 | 0 |
| B | 0 | 152 | 0 |
| C | 0 | 152 | 0 |
| D | 0 | 152 | 0 |
| Quadrant | Total seconds | Saturated seconds | Saturation percentage |
|---|---|---|---|
| A | 7484 | 638 | 8.524853% |
| B | 7484 | 403 | 5.384821% |
| C | 7484 | 7427 | 99.238375% |
| D | 7484 | 7483 | 99.986638% |
Noise dominated data is calculated using 1-second bins in cleaned event files. If a bin has >2000 counts, and if more than 50% of those come from <1% of pixels, then it is considered to be noise-dominated and hence unusable.
| Quadrant | # 1 sec bins | Bins with >0 counts | Bins with >2000 counts | High rate bins dominated by noise | Noise dominated (total time) | Noise dominated (detector-on time) | Marked lightcurve |
|---|---|---|---|---|---|---|---|
| A | 7784 | 7483 | 0 | 0 | 0.00% | 0.00% |  |
| B | 7784 | 7483 | 0 | 0 | 0.00% | 0.00% |  |
| C | 7783 | 7132 | 0 | 0 | 0.00% | 0.00% |  |
| D | 7783 | 6438 | 0 | 0 | 0.00% | 0.00% | 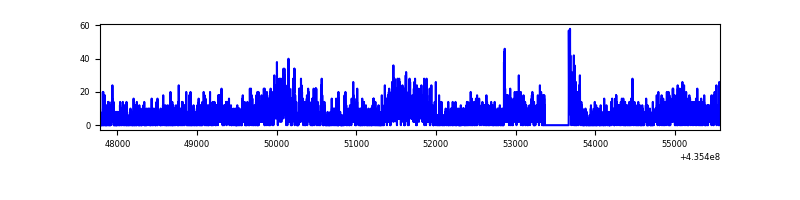 |
Top three noisy pixels from each quadrant. If the there are fewer than three noisy pixels in the level2.evt file, extra rows are filled as -1
| Pixel properties | Quadrant properties | ||||||
|---|---|---|---|---|---|---|---|
| Quadrant | DetID | PixID | Counts | Sigma | Mean | Median | Sigma |
| A | 0 | 29 | 328 | 9.25 | 95 | 90 | 25.7 |
| A | 7 | 110 | 294 | 7.93 | 95 | 90 | 25.7 |
| A | 0 | 30 | 284 | 7.54 | 95 | 90 | 25.7 |
| B | 2 | 9 | 332 | 11.3 | 96 | 92 | 21.2 |
| B | 5 | 232 | 266 | 8.19 | 96 | 92 | 21.2 |
| B | 2 | 8 | 258 | 7.82 | 96 | 92 | 21.2 |
| C | 1 | 65 | 88 | 7.73 | 25 | 24 | 8.3 |
| C | 7 | 221 | 79 | 6.65 | 25 | 24 | 8.3 |
| C | 1 | 81 | 79 | 6.65 | 25 | 24 | 8.3 |
| D | 15 | 30 | 44 | 6.49 | 13 | 11 | 5.1 |
| D | 6 | 38 | 44 | 6.49 | 13 | 11 | 5.1 |
| D | 15 | 46 | 40 | 5.7 | 13 | 11 | 5.1 |
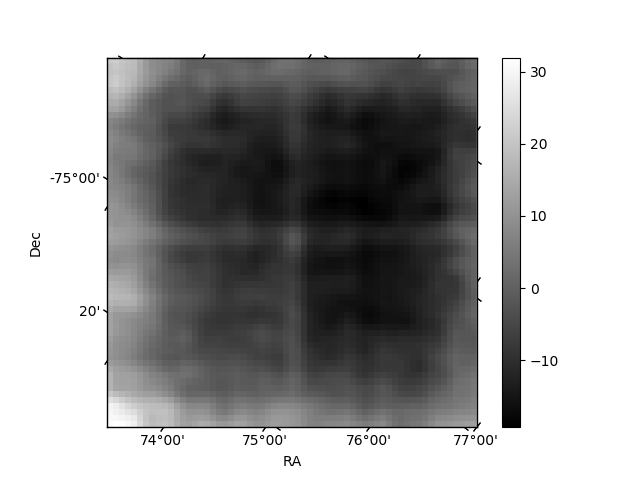
Histogram calculated using DETX and DETY for each event in the final _common_clean file
| Quadrant A |  |
 |
Quadrant B |
|---|---|---|---|
| Quadrant D |  |
 |
Quadrant C |
| Plot type | Count rate plots | Images |
|---|---|---|
| Comparison with Poisson distribution Blue bars denote a histogram of data divided into 1 sec bins. Red curve is a Poisson curve with rate = median count rate of data. |
 |
 |
| Quadrant-wise count rates Data is divided into 100 sec bins |
 |
|
| Module-wise count rates for Quadrant A Data is divided into 100 sec bins |
 |
 |
| Module-wise count rates for Quadrant B Data is divided into 100 sec bins |
 |
 |
| Module-wise count rates for Quadrant C Data is divided into 100 sec bins |
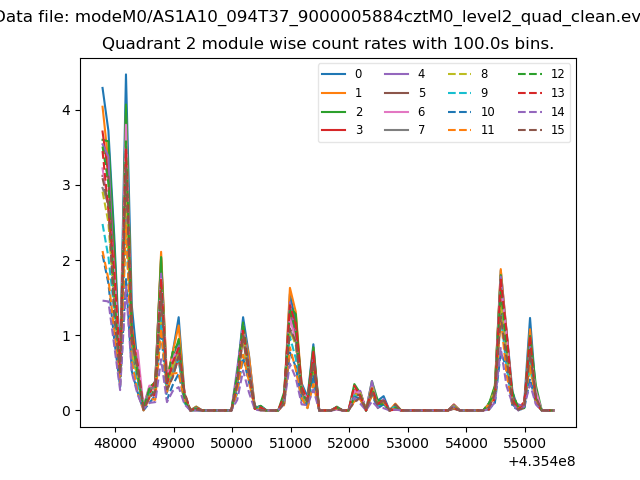 |
 |
| Module-wise count rates for Quadrant D Data is divided into 100 sec bins |
 |
 |
| Parameter | Plot |
|---|---|
| CZT HV Monitor |  |
| D_VDD |  |
| Temperature 1 | 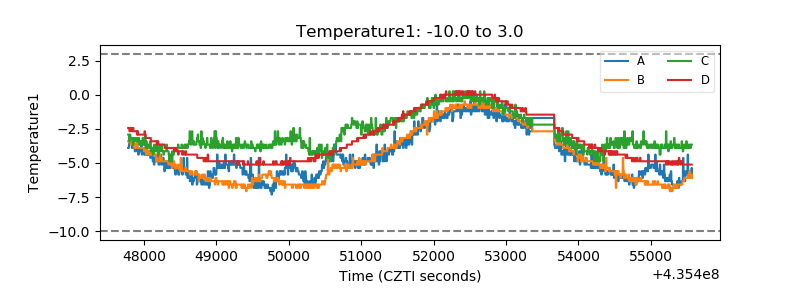 |
| Veto HV Monitor |  |
| Veto LLD |  |
| Alpha Counter |  |
| _CPM_Rate |  |
| CZT Counter |  |
| +2.5 Volts monitor |  |
| +5 Volts monitor | 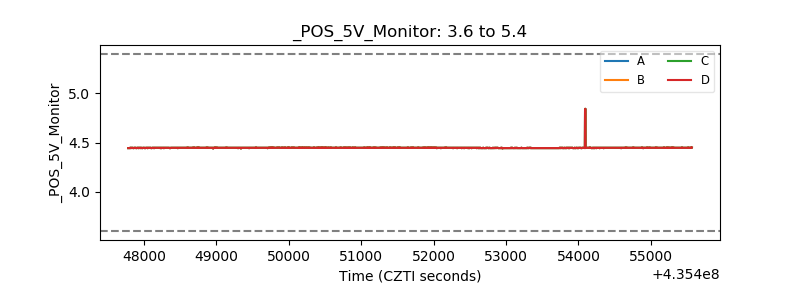 |
| _ROLL_ROT |  |
| _Roll_DEC |  |
| _Roll_RA |  |
| Veto Counter | 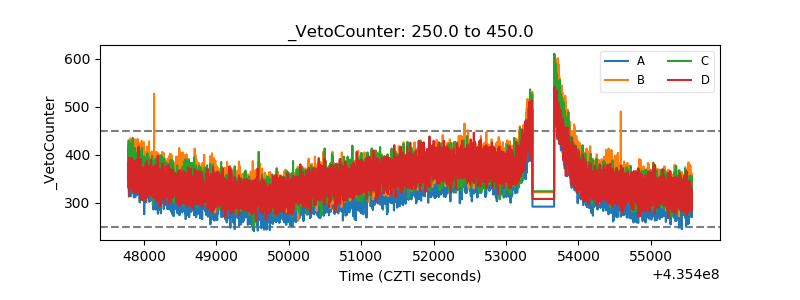 |