| Param | Original file | Final file |
|---|---|---|
| Filename | modeM0/AS1A05_174T01_9000005880cztM0_level2.fits | modeM0/AS1A05_174T01_9000005880cztM0_level2_quad_clean.evt |
| Size (bytes) | 1,026,711,360 | 976,069,440 |
| Size | 979.1 MB | 930.9 MB |
| Events in quadrant A | 7,875,372 | 8,353,102 |
| Events in quadrant B | 8,022,660 | 9,119,894 |
| Events in quadrant C | 3,360,670 | 1,400,521 |
| Events in quadrant D | 1,003,108 | 1,630 |
| Mode M9 | |||
|---|---|---|---|
| Quadrant | BADHDUFLAG | Total packets | Discarded packets |
| A | 0 | 222 | 0 |
| B | 0 | 222 | 0 |
| C | 0 | 222 | 0 |
| D | 0 | 222 | 0 |
| Mode M0 | |||
|---|---|---|---|
| Quadrant | BADHDUFLAG | Total packets | Discarded packets |
| A | 0 | 632255 | 0 |
| B | 0 | 427336 | 0 |
| C | 0 | 1221430 | 0 |
| D | 0 | 1082211 | 0 |
| Mode SS | |||
|---|---|---|---|
| Quadrant | BADHDUFLAG | Total packets | Discarded packets |
| A | 0 | 3170 | 0 |
| B | 0 | 3168 | 0 |
| C | 0 | 3170 | 0 |
| D | 0 | 3170 | 0 |
| Quadrant | Total seconds | Saturated seconds | Saturation percentage |
|---|---|---|---|
| A | 155818 | 22097 | 14.181288% |
| B | 155831 | 6636 | 4.258459% |
| C | 155823 | 133553 | 85.708143% |
| D | 155815 | 155466 | 99.776016% |
Noise dominated data is calculated using 1-second bins in cleaned event files. If a bin has >2000 counts, and if more than 50% of those come from <1% of pixels, then it is considered to be noise-dominated and hence unusable.
| Quadrant | # 1 sec bins | Bins with >0 counts | Bins with >2000 counts | High rate bins dominated by noise | Noise dominated (total time) | Noise dominated (detector-on time) | Marked lightcurve |
|---|---|---|---|---|---|---|---|
| A | 196120 | 155737 | 0 | 0 | 0.00% | 0.00% |  |
| B | 196120 | 155793 | 0 | 0 | 0.00% | 0.00% |  |
| C | 196120 | 138240 | 0 | 0 | 0.00% | 0.00% |  |
| D | 196120 | 126034 | 0 | 0 | 0.00% | 0.00% |  |
Top three noisy pixels from each quadrant. If the there are fewer than three noisy pixels in the level2.evt file, extra rows are filled as -1
| Pixel properties | Quadrant properties | ||||||
|---|---|---|---|---|---|---|---|
| Quadrant | DetID | PixID | Counts | Sigma | Mean | Median | Sigma |
| A | 7 | 110 | 6909 | 9.74 | 2067 | 1930 | 511.0 |
| A | 0 | 29 | 6371 | 8.69 | 2067 | 1930 | 511.0 |
| A | 0 | 30 | 6184 | 8.32 | 2067 | 1930 | 511.0 |
| B | 2 | 9 | 7050 | 12.07 | 2127 | 2023 | 416.4 |
| B | 3 | 17 | 5801 | 9.07 | 2127 | 2023 | 416.4 |
| B | 5 | 232 | 5700 | 8.83 | 2127 | 2023 | 416.4 |
| C | 1 | 81 | 2704 | 8.22 | 896 | 837 | 227.1 |
| C | 3 | 203 | 2640 | 7.94 | 896 | 837 | 227.1 |
| C | 1 | 80 | 2640 | 7.94 | 896 | 837 | 227.1 |
| D | 6 | 38 | 778 | 6.21 | 294 | 266 | 82.5 |
| D | 7 | 3 | 751 | 5.88 | 294 | 266 | 82.5 |
| D | 3 | 159 | 746 | 5.82 | 294 | 266 | 82.5 |
Histogram calculated using DETX and DETY for each event in the final _common_clean file
| Quadrant A |  |
 |
Quadrant B |
|---|---|---|---|
| Quadrant D |  |
 |
Quadrant C |
| Plot type | Count rate plots | Images |
|---|---|---|
| Comparison with Poisson distribution Blue bars denote a histogram of data divided into 1 sec bins. Red curve is a Poisson curve with rate = median count rate of data. |
 |
 |
| Quadrant-wise count rates Data is divided into 100 sec bins |
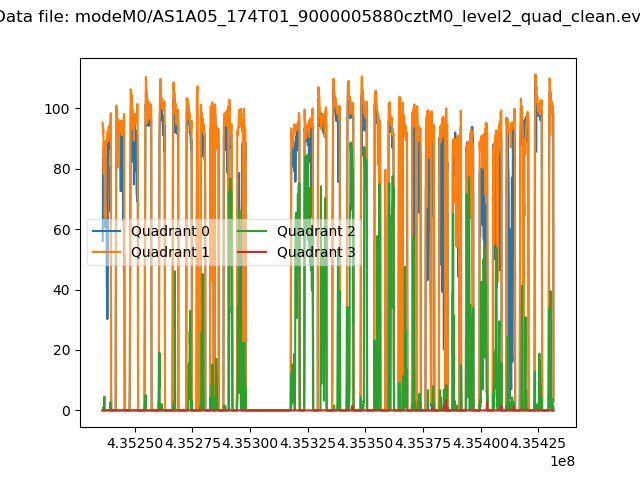 |
|
| Module-wise count rates for Quadrant A Data is divided into 100 sec bins |
 |
 |
| Module-wise count rates for Quadrant B Data is divided into 100 sec bins |
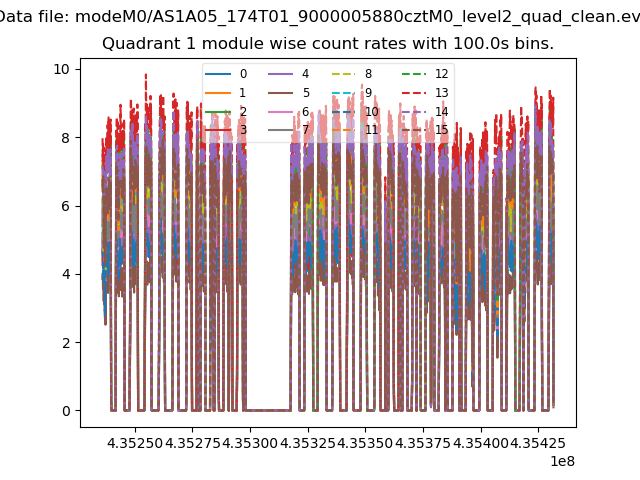 |
 |
| Module-wise count rates for Quadrant C Data is divided into 100 sec bins |
 |
 |
| Module-wise count rates for Quadrant D Data is divided into 100 sec bins |
 |
 |
| Parameter | Plot |
|---|---|
| CZT HV Monitor |  |
| D_VDD | 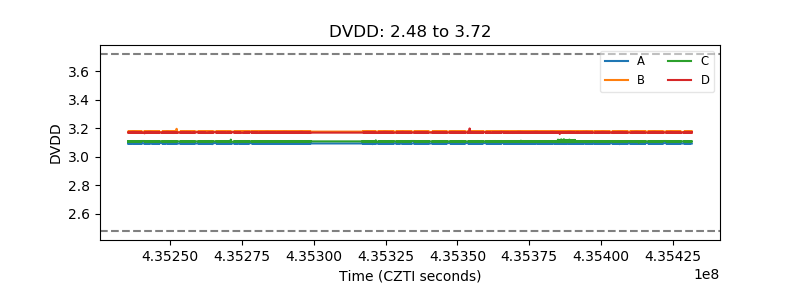 |
| Temperature 1 |  |
| Veto HV Monitor |  |
| Veto LLD | 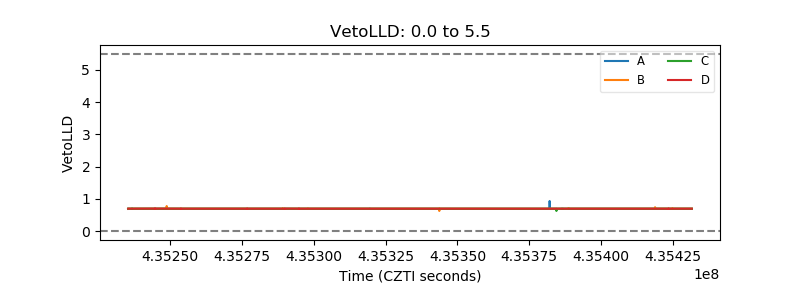 |
| Alpha Counter |  |
| _CPM_Rate |  |
| CZT Counter | 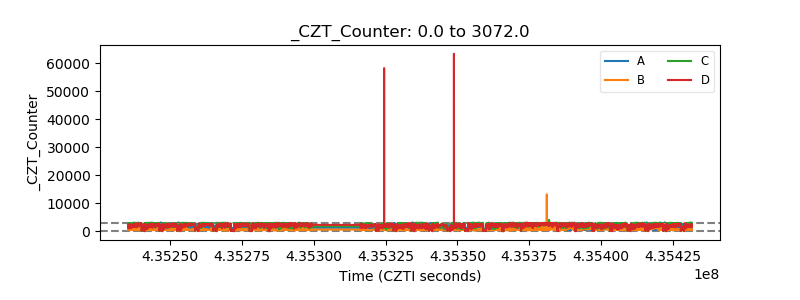 |
| +2.5 Volts monitor | 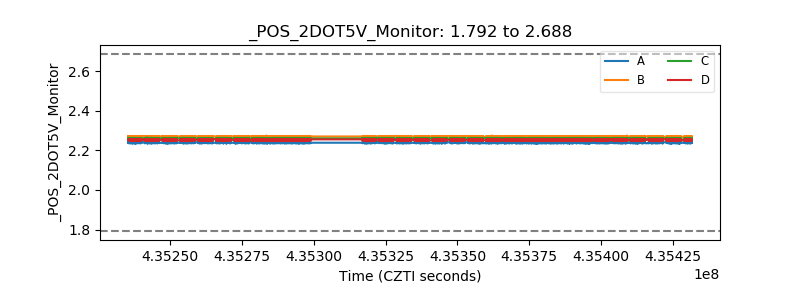 |
| +5 Volts monitor |  |
| _ROLL_ROT | 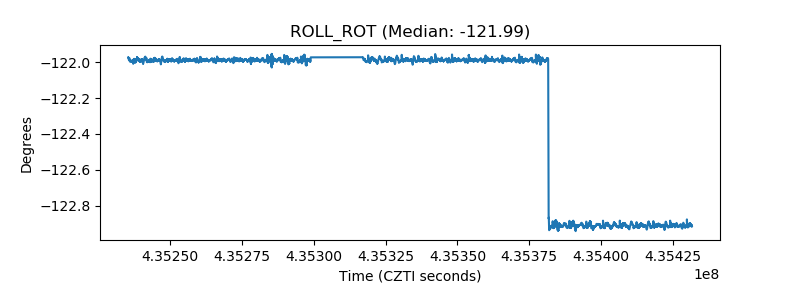 |
| _Roll_DEC |  |
| _Roll_RA | 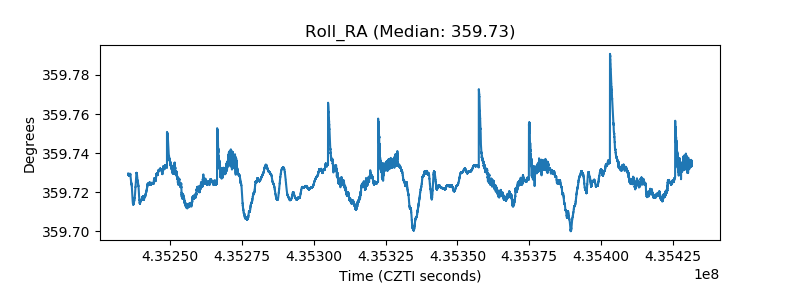 |
| Veto Counter |  |