| Param | Original file | Final file |
|---|---|---|
| Filename | modeM0/AS1A12_102T01_9000005876cztM0_level2.fits | modeM0/AS1A12_102T01_9000005876cztM0_level2_quad_clean.evt |
| Size (bytes) | 372,994,560 | 406,690,560 |
| Size | 355.7 MB | 387.9 MB |
| Events in quadrant A | 2,910,892 | 3,760,058 |
| Events in quadrant B | 2,734,422 | 3,419,861 |
| Events in quadrant C | 1,076,864 | 699,661 |
| Events in quadrant D | 72,660 | 606 |
| Mode SS | |||
|---|---|---|---|
| Quadrant | BADHDUFLAG | Total packets | Discarded packets |
| A | 0 | 1306 | 0 |
| B | 0 | 1306 | 0 |
| C | 0 | 1306 | 0 |
| D | 0 | 1306 | 0 |
| Mode M9 | |||
|---|---|---|---|
| Quadrant | BADHDUFLAG | Total packets | Discarded packets |
| A | 0 | 79 | 0 |
| B | 0 | 79 | 0 |
| C | 0 | 79 | 0 |
| D | 0 | 79 | 0 |
| Mode M0 | |||
|---|---|---|---|
| Quadrant | BADHDUFLAG | Total packets | Discarded packets |
| A | 0 | 339418 | 0 |
| B | 0 | 318008 | 0 |
| C | 0 | 529266 | 0 |
| D | 0 | 413383 | 0 |
| Quadrant | Total seconds | Saturated seconds | Saturation percentage |
|---|---|---|---|
| A | 64427 | 21701 | 33.683083% |
| B | 64429 | 21063 | 32.691800% |
| C | 64429 | 60029 | 93.170777% |
| D | 64430 | 64430 | 100.000000% |
Noise dominated data is calculated using 1-second bins in cleaned event files. If a bin has >2000 counts, and if more than 50% of those come from <1% of pixels, then it is considered to be noise-dominated and hence unusable.
| Quadrant | # 1 sec bins | Bins with >0 counts | Bins with >2000 counts | High rate bins dominated by noise | Noise dominated (total time) | Noise dominated (detector-on time) | Marked lightcurve |
|---|---|---|---|---|---|---|---|
| A | 72262 | 64322 | 0 | 0 | 0.00% | 0.00% | 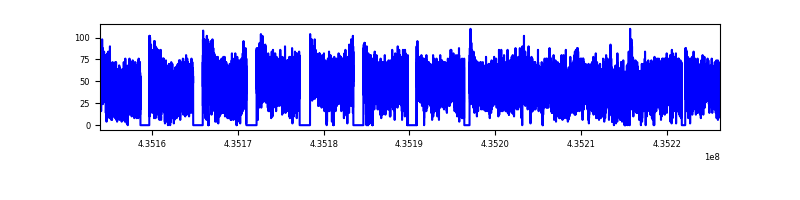 |
| B | 72262 | 64003 | 0 | 0 | 0.00% | 0.00% | 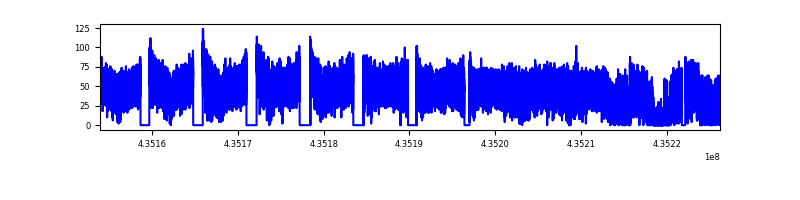 |
| C | 72262 | 59988 | 0 | 0 | 0.00% | 0.00% |  |
| D | 72241 | 20932 | 0 | 0 | 0.00% | 0.00% |  |
Top three noisy pixels from each quadrant. If the there are fewer than three noisy pixels in the level2.evt file, extra rows are filled as -1
| Pixel properties | Quadrant properties | ||||||
|---|---|---|---|---|---|---|---|
| Quadrant | DetID | PixID | Counts | Sigma | Mean | Median | Sigma |
| A | 7 | 110 | 2576 | 9.88 | 765 | 722 | 187.6 |
| A | 0 | 29 | 2384 | 8.86 | 765 | 722 | 187.6 |
| A | 0 | 30 | 2280 | 8.3 | 765 | 722 | 187.6 |
| B | 2 | 9 | 2403 | 12.12 | 728 | 696 | 140.9 |
| B | 5 | 232 | 1890 | 8.48 | 728 | 696 | 140.9 |
| B | 2 | 8 | 1864 | 8.29 | 728 | 696 | 140.9 |
| C | 1 | 81 | 913 | 8.74 | 288 | 271 | 73.5 |
| C | 1 | 80 | 876 | 8.23 | 288 | 271 | 73.5 |
| C | 3 | 203 | 872 | 8.18 | 288 | 271 | 73.5 |
| D | 14 | 238 | 65 | 5.82 | 21 | 19 | 7.9 |
| D | 7 | 3 | 62 | 5.44 | 21 | 19 | 7.9 |
| D | 3 | 159 | 61 | 5.31 | 21 | 19 | 7.9 |
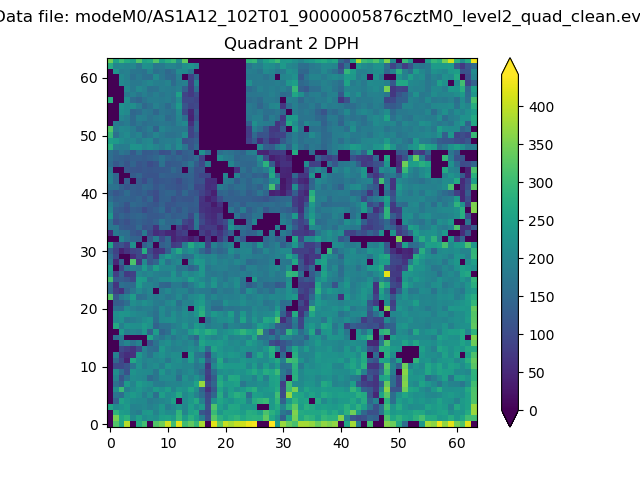
Histogram calculated using DETX and DETY for each event in the final _common_clean file
| Quadrant A | 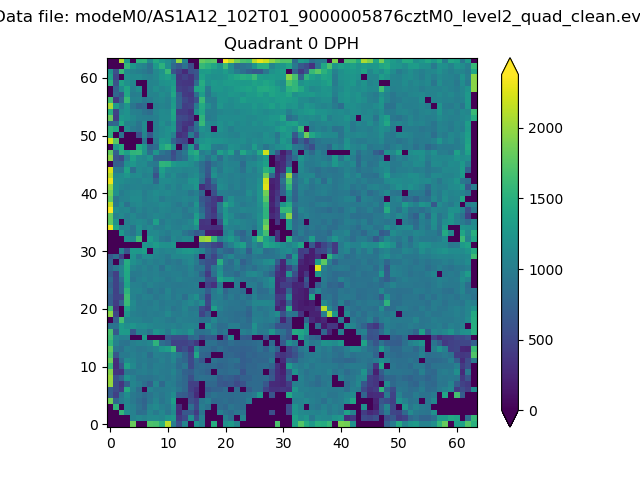 |
 |
Quadrant B |
|---|---|---|---|
| Quadrant D | 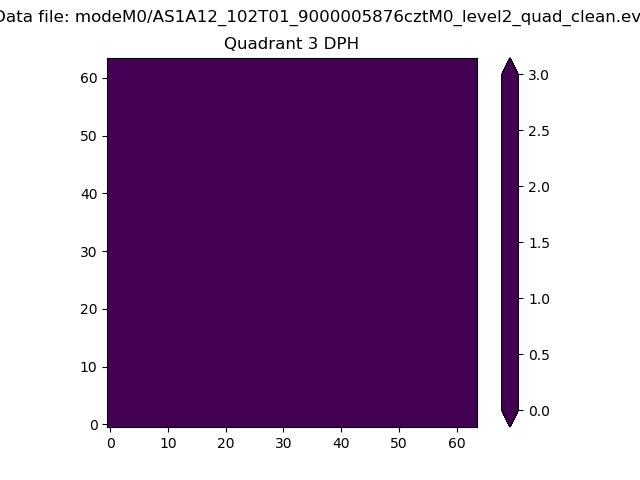 |
 |
Quadrant C |
| Plot type | Count rate plots | Images |
|---|---|---|
| Comparison with Poisson distribution Blue bars denote a histogram of data divided into 1 sec bins. Red curve is a Poisson curve with rate = median count rate of data. |
 |
 |
| Quadrant-wise count rates Data is divided into 100 sec bins |
 |
|
| Module-wise count rates for Quadrant A Data is divided into 100 sec bins |
 |
 |
| Module-wise count rates for Quadrant B Data is divided into 100 sec bins |
 |
 |
| Module-wise count rates for Quadrant C Data is divided into 100 sec bins |
 |
 |
| Module-wise count rates for Quadrant D Data is divided into 100 sec bins |
 |
 |
| Parameter | Plot |
|---|---|
| CZT HV Monitor | 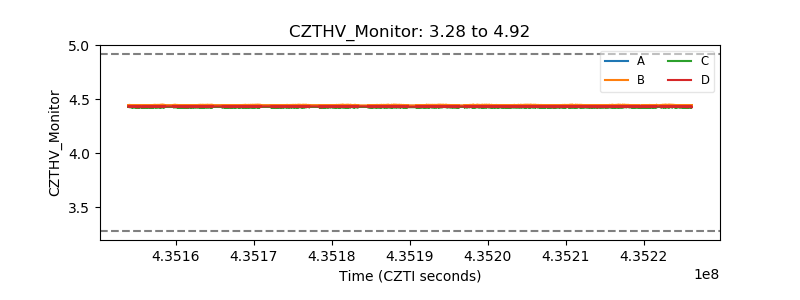 |
| D_VDD |  |
| Temperature 1 |  |
| Veto HV Monitor |  |
| Veto LLD |  |
| Alpha Counter | 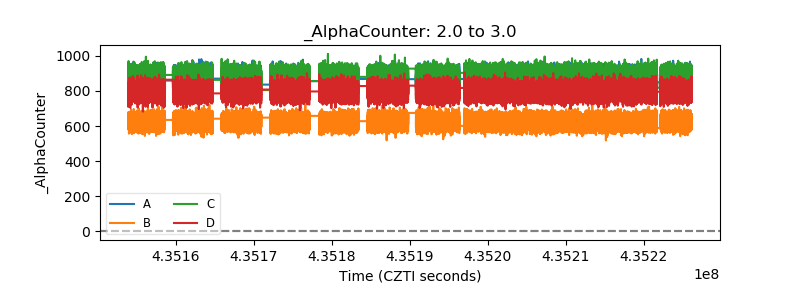 |
| _CPM_Rate | 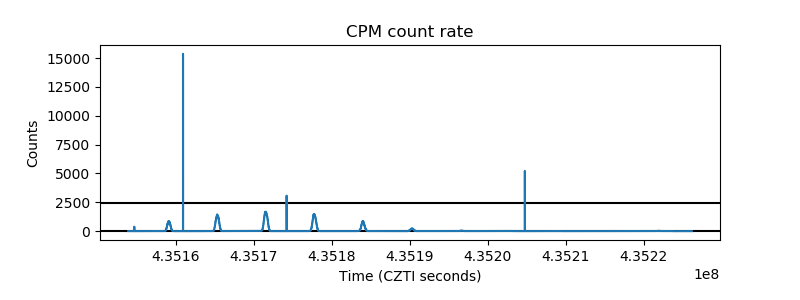 |
| CZT Counter |  |
| +2.5 Volts monitor |  |
| +5 Volts monitor |  |
| _ROLL_ROT |  |
| _Roll_DEC |  |
| _Roll_RA |  |
| Veto Counter |  |