| Param | Original file | Final file |
|---|---|---|
| Filename | modeM0/AS1A12_018T01_9000005874cztM0_level2.fits | modeM0/AS1A12_018T01_9000005874cztM0_level2_quad_clean.evt |
| Size (bytes) | 3,609,639,360 | 5,758,755,840 |
| Size | 3.4 GB | 5.4 GB |
| Events in quadrant A | 20,093,056 | 35,461,401 |
| Events in quadrant B | 20,994,322 | 39,794,217 |
| Events in quadrant C | 21,516,120 | 37,898,989 |
| Events in quadrant D | 17,556,200 | 32,162,333 |
| Mode M0 | |||
|---|---|---|---|
| Quadrant | BADHDUFLAG | Total packets | Discarded packets |
| A | 0 | 1321934 | 0 |
| B | 0 | 942476 | 0 |
| C | 0 | 871909 | 0 |
| D | 0 | 1347802 | 0 |
| Mode M9 | |||
|---|---|---|---|
| Quadrant | BADHDUFLAG | Total packets | Discarded packets |
| A | 0 | 1603 | 0 |
| B | 0 | 1605 | 0 |
| C | 0 | 1606 | 0 |
| D | 0 | 1606 | 0 |
| Mode SS | |||
|---|---|---|---|
| Quadrant | BADHDUFLAG | Total packets | Discarded packets |
| A | 0 | 8704 | 0 |
| B | 0 | 8702 | 0 |
| C | 0 | 8704 | 0 |
| D | 0 | 8704 | 0 |
| Quadrant | Total seconds | Saturated seconds | Saturation percentage |
|---|---|---|---|
| A | 425163 | 50495 | 11.876621% |
| B | 425166 | 3759 | 0.884125% |
| C | 425160 | 529 | 0.124424% |
| D | 425159 | 36650 | 8.620304% |
Noise dominated data is calculated using 1-second bins in cleaned event files. If a bin has >2000 counts, and if more than 50% of those come from <1% of pixels, then it is considered to be noise-dominated and hence unusable.
| Quadrant | # 1 sec bins | Bins with >0 counts | Bins with >2000 counts | High rate bins dominated by noise | Noise dominated (total time) | Noise dominated (detector-on time) | Marked lightcurve |
|---|---|---|---|---|---|---|---|
| A | 651344 | 418180 | 0 | 0 | 0.00% | 0.00% |  |
| B | 651344 | 425081 | 0 | 0 | 0.00% | 0.00% |  |
| C | 651344 | 425160 | 0 | 0 | 0.00% | 0.00% | 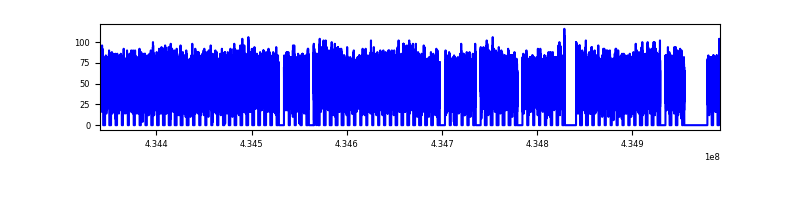 |
| D | 651344 | 424037 | 0 | 0 | 0.00% | 0.00% | 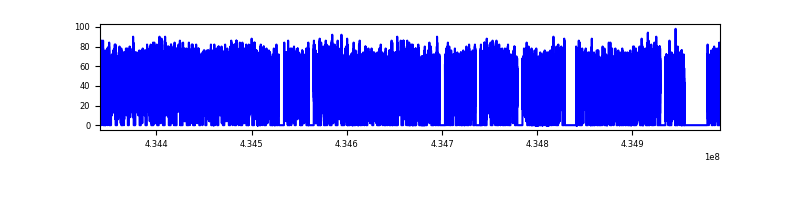 |
Top three noisy pixels from each quadrant. If the there are fewer than three noisy pixels in the level2.evt file, extra rows are filled as -1
| Pixel properties | Quadrant properties | ||||||
|---|---|---|---|---|---|---|---|
| Quadrant | DetID | PixID | Counts | Sigma | Mean | Median | Sigma |
| A | 7 | 110 | 17290 | 9.5 | 5250 | 4930 | 1300.7 |
| A | 9 | 19 | 16708 | 9.05 | 5250 | 4930 | 1300.7 |
| A | 0 | 29 | 16658 | 9.02 | 5250 | 4930 | 1300.7 |
| B | 2 | 9 | 18210 | 12.25 | 5562 | 5313 | 1053.1 |
| B | 2 | 8 | 14784 | 8.99 | 5562 | 5313 | 1053.1 |
| B | 3 | 80 | 14743 | 8.95 | 5562 | 5313 | 1053.1 |
| C | 1 | 81 | 18133 | 8.94 | 5694 | 5345 | 1429.9 |
| C | 3 | 202 | 17336 | 8.39 | 5694 | 5345 | 1429.9 |
| C | 1 | 80 | 17321 | 8.38 | 5694 | 5345 | 1429.9 |
| D | 10 | 189 | 13400 | 6.57 | 5037 | 4570 | 1343.5 |
| D | 7 | 3 | 12941 | 6.23 | 5037 | 4570 | 1343.5 |
| D | 4 | 160 | 12930 | 6.22 | 5037 | 4570 | 1343.5 |
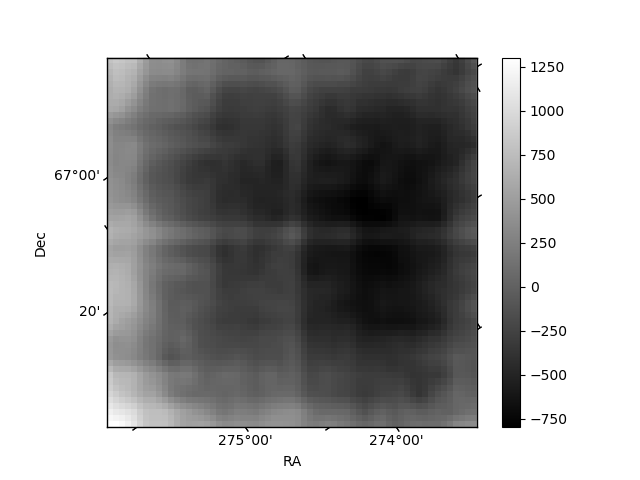
Histogram calculated using DETX and DETY for each event in the final _common_clean file
| Quadrant A |  |
 |
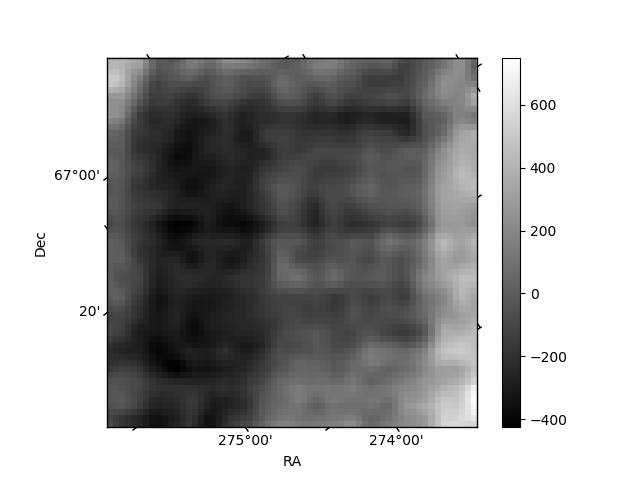
Quadrant B |
|---|---|---|---|
| Quadrant D |  |
 |
Quadrant C |
| Plot type | Count rate plots | Images |
|---|---|---|
| Comparison with Poisson distribution Blue bars denote a histogram of data divided into 1 sec bins. Red curve is a Poisson curve with rate = median count rate of data. |
 |
 |
| Quadrant-wise count rates Data is divided into 100 sec bins |
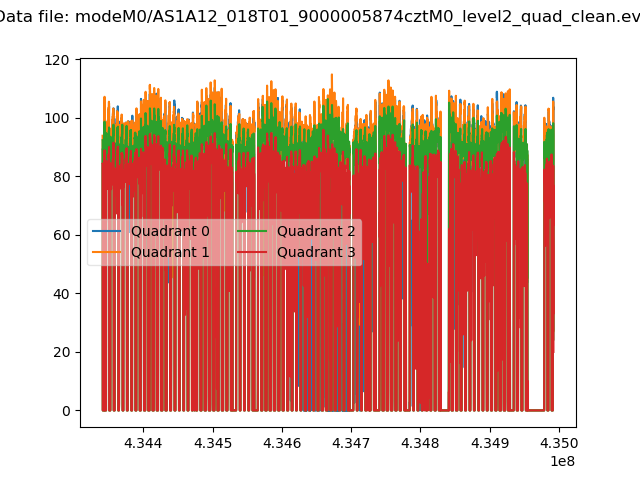 |
|
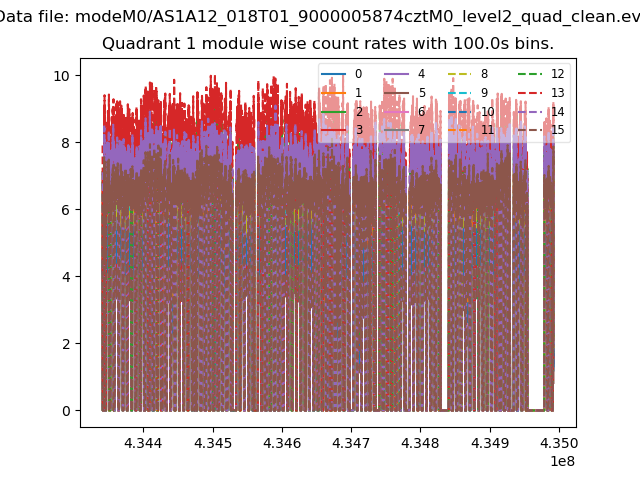
| Module-wise count rates for Quadrant A Data is divided into 100 sec bins |
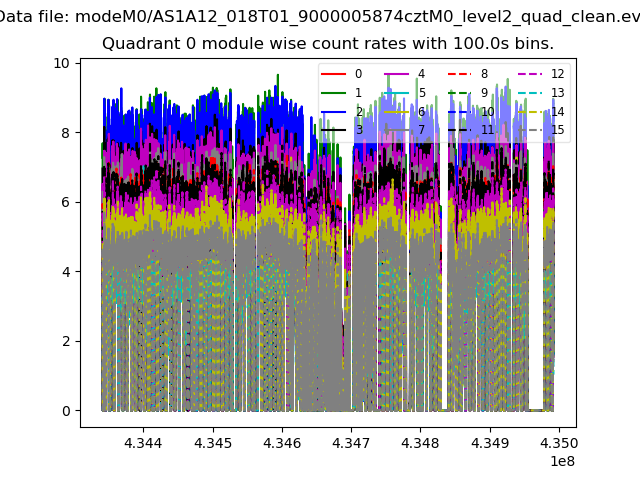 |
 |
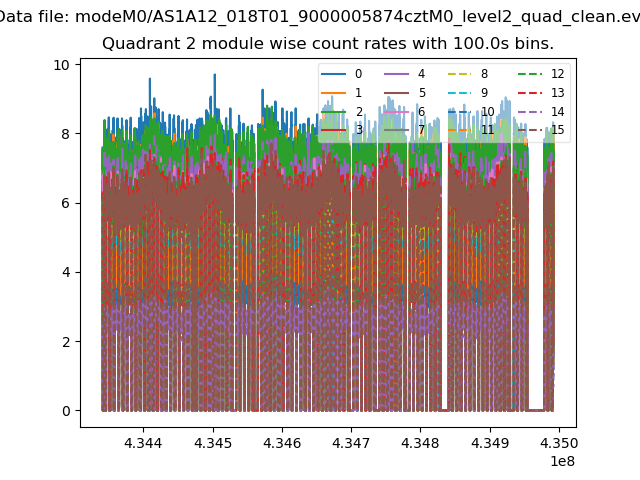
| Module-wise count rates for Quadrant B Data is divided into 100 sec bins |
 |
 |
| Module-wise count rates for Quadrant C Data is divided into 100 sec bins |
 |
 |
| Module-wise count rates for Quadrant D Data is divided into 100 sec bins |
 |
 |
| Parameter | Plot |
|---|---|
| CZT HV Monitor |  |
| D_VDD |  |
| Temperature 1 |  |
| Veto HV Monitor | 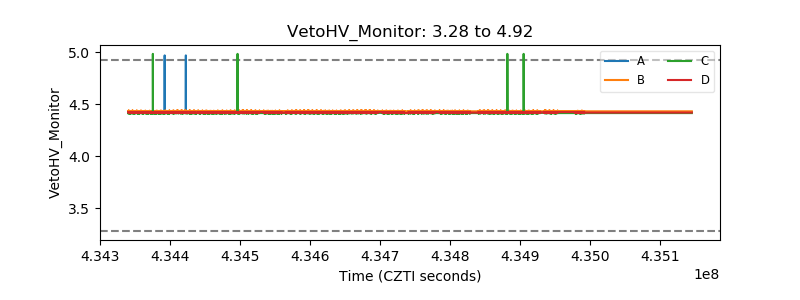 |
| Veto LLD |  |
| Alpha Counter |  |
| _CPM_Rate |  |
| CZT Counter |  |
| +2.5 Volts monitor |  |
| +5 Volts monitor | 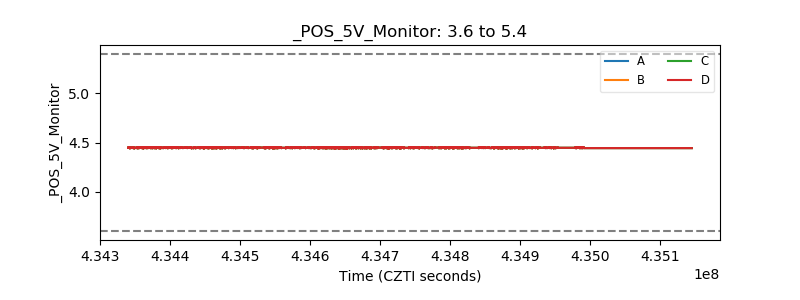 |
| _ROLL_ROT | 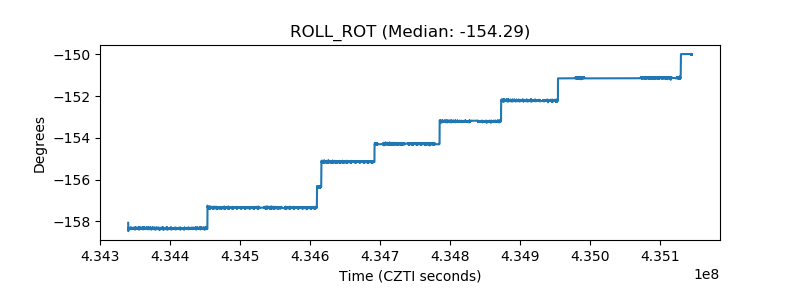 |
| _Roll_DEC |  |
| _Roll_RA |  |
| Veto Counter |  |