| Param | Original file | Final file |
|---|---|---|
| Filename | modeM0/AS1C07_001T10_9000005872cztM0_level2.fits | modeM0/AS1C07_001T10_9000005872cztM0_level2_quad_clean.evt |
| Size (bytes) | 360,221,760 | 557,291,520 |
| Size | 343.5 MB | 531.5 MB |
| Events in quadrant A | 2,115,762 | 3,635,057 |
| Events in quadrant B | 2,069,100 | 3,715,199 |
| Events in quadrant C | 2,091,514 | 3,505,388 |
| Events in quadrant D | 1,805,484 | 3,197,654 |
| Mode SS | |||
|---|---|---|---|
| Quadrant | BADHDUFLAG | Total packets | Discarded packets |
| A | 0 | 844 | 0 |
| B | 0 | 844 | 0 |
| C | 0 | 844 | 0 |
| D | 0 | 844 | 0 |
| Mode M9 | |||
|---|---|---|---|
| Quadrant | BADHDUFLAG | Total packets | Discarded packets |
| A | 0 | 169 | 0 |
| B | 0 | 169 | 0 |
| C | 0 | 169 | 0 |
| D | 0 | 169 | 0 |
| Mode M0 | |||
|---|---|---|---|
| Quadrant | BADHDUFLAG | Total packets | Discarded packets |
| A | 0 | 94126 | 0 |
| B | 0 | 84345 | 0 |
| C | 0 | 91521 | 0 |
| D | 0 | 99310 | 0 |
| Quadrant | Total seconds | Saturated seconds | Saturation percentage |
|---|---|---|---|
| A | 41174 | 534 | 1.296935% |
| B | 41174 | 113 | 0.274445% |
| C | 41174 | 146 | 0.354593% |
| D | 41174 | 1065 | 2.586584% |
Noise dominated data is calculated using 1-second bins in cleaned event files. If a bin has >2000 counts, and if more than 50% of those come from <1% of pixels, then it is considered to be noise-dominated and hence unusable.
| Quadrant | # 1 sec bins | Bins with >0 counts | Bins with >2000 counts | High rate bins dominated by noise | Noise dominated (total time) | Noise dominated (detector-on time) | Marked lightcurve |
|---|---|---|---|---|---|---|---|
| A | 58173 | 41154 | 0 | 0 | 0.00% | 0.00% |  |
| B | 58173 | 41174 | 0 | 0 | 0.00% | 0.00% |  |
| C | 58173 | 41174 | 0 | 0 | 0.00% | 0.00% |  |
| D | 58173 | 41149 | 0 | 0 | 0.00% | 0.00% | 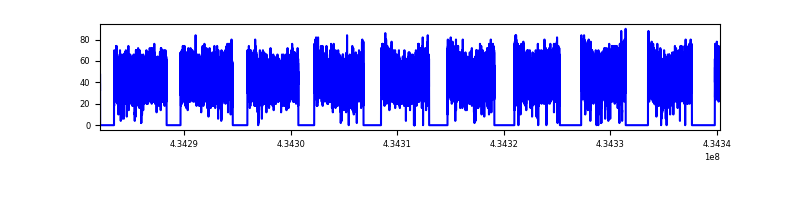 |
Top three noisy pixels from each quadrant. If the there are fewer than three noisy pixels in the level2.evt file, extra rows are filled as -1
| Pixel properties | Quadrant properties | ||||||
|---|---|---|---|---|---|---|---|
| Quadrant | DetID | PixID | Counts | Sigma | Mean | Median | Sigma |
| A | 0 | 29 | 1765 | 8.78 | 553 | 519 | 142.0 |
| A | 9 | 19 | 1762 | 8.76 | 553 | 519 | 142.0 |
| A | 7 | 110 | 1716 | 8.43 | 553 | 519 | 142.0 |
| B | 2 | 9 | 1815 | 12.19 | 547 | 522 | 106.1 |
| B | 2 | 8 | 1508 | 9.29 | 547 | 522 | 106.1 |
| B | 3 | 17 | 1427 | 8.53 | 547 | 522 | 106.1 |
| C | 1 | 81 | 1795 | 9.02 | 553 | 517 | 141.7 |
| C | 1 | 80 | 1769 | 8.84 | 553 | 517 | 141.7 |
| C | 3 | 203 | 1607 | 7.69 | 553 | 517 | 141.7 |
| D | 10 | 189 | 1369 | 6.44 | 516 | 470 | 139.6 |
| D | 4 | 160 | 1360 | 6.38 | 516 | 470 | 139.6 |
| D | 10 | 113 | 1358 | 6.36 | 516 | 470 | 139.6 |
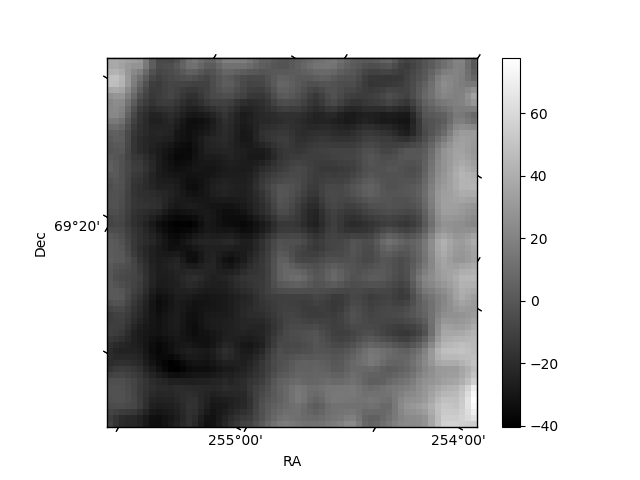
Histogram calculated using DETX and DETY for each event in the final _common_clean file
| Quadrant A | 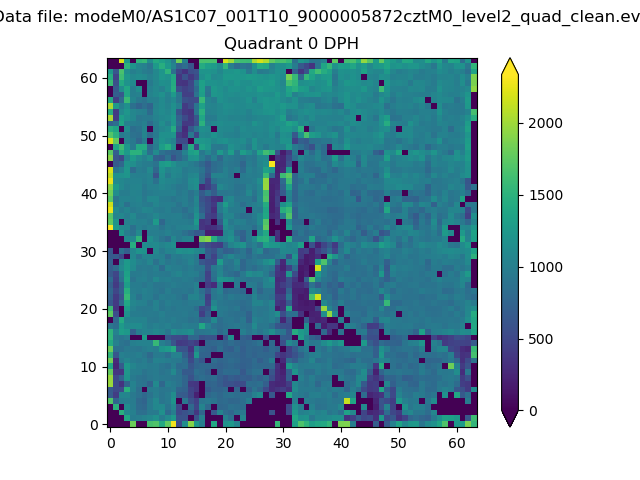 |
 |
Quadrant B |
|---|---|---|---|
| Quadrant D |  |
 |
Quadrant C |
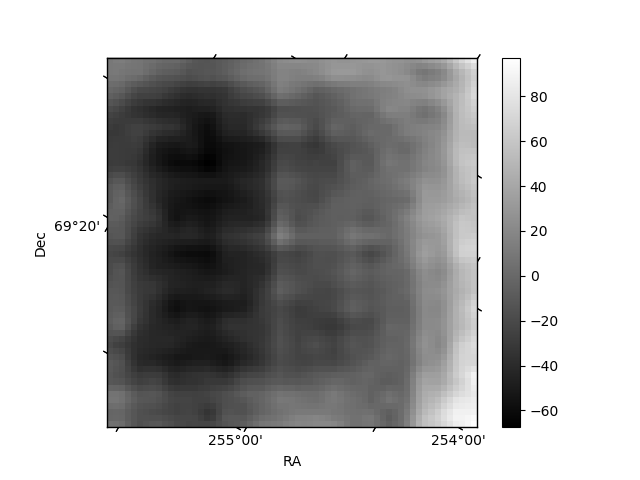
| Plot type | Count rate plots | Images |
|---|---|---|
| Comparison with Poisson distribution Blue bars denote a histogram of data divided into 1 sec bins. Red curve is a Poisson curve with rate = median count rate of data. |
 |
 |
| Quadrant-wise count rates Data is divided into 100 sec bins |
 |
|
| Module-wise count rates for Quadrant A Data is divided into 100 sec bins |
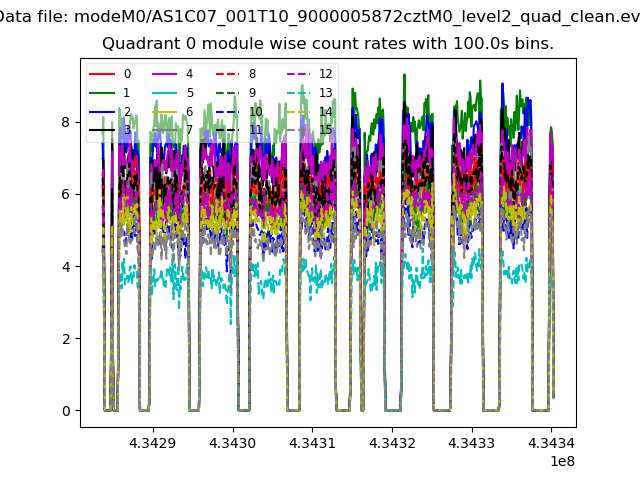 |
 |
| Module-wise count rates for Quadrant B Data is divided into 100 sec bins |
 |
 |
| Module-wise count rates for Quadrant C Data is divided into 100 sec bins |
 |
 |
| Module-wise count rates for Quadrant D Data is divided into 100 sec bins |
 |
 |
| Parameter | Plot |
|---|---|
| CZT HV Monitor |  |
| D_VDD | 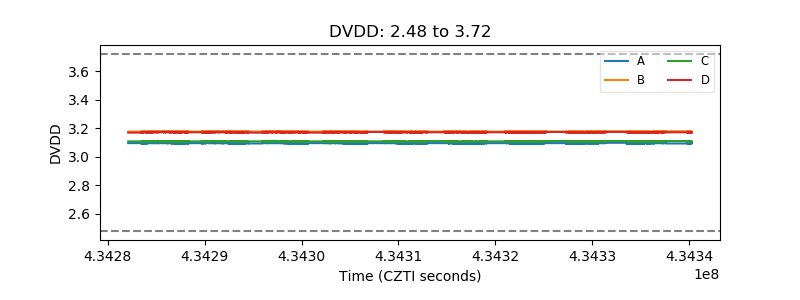 |
| Temperature 1 | 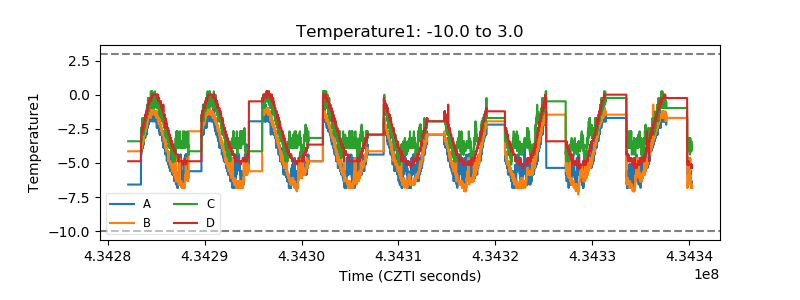 |
| Veto HV Monitor | 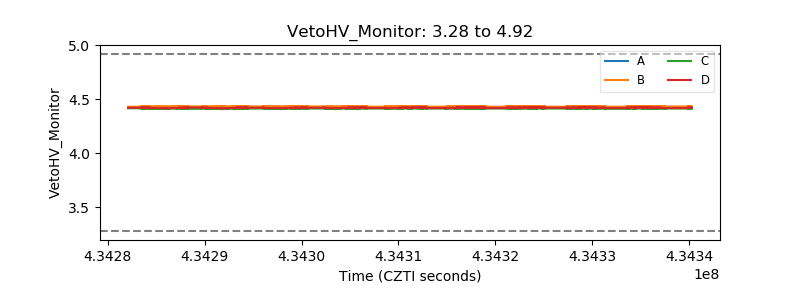 |
| Veto LLD |  |
| Alpha Counter | 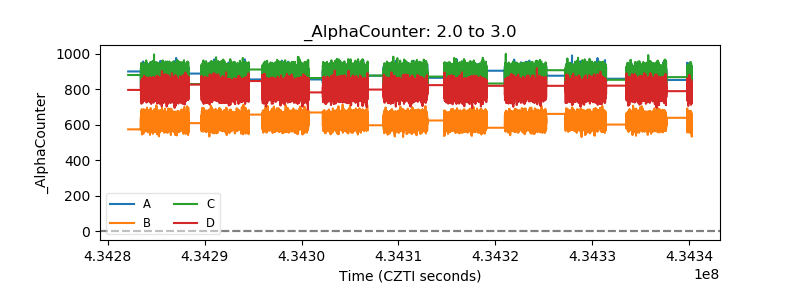 |
| _CPM_Rate |  |
| CZT Counter | 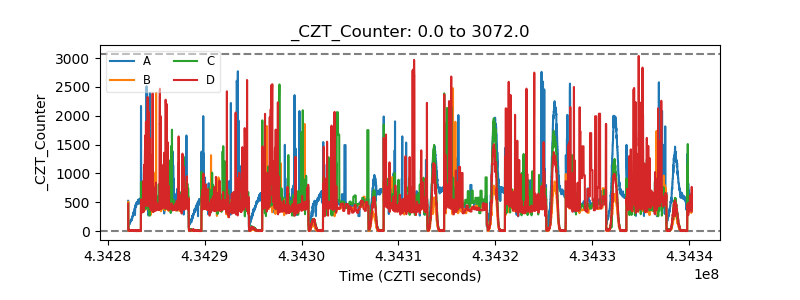 |
| +2.5 Volts monitor |  |
| +5 Volts monitor |  |
| _ROLL_ROT | 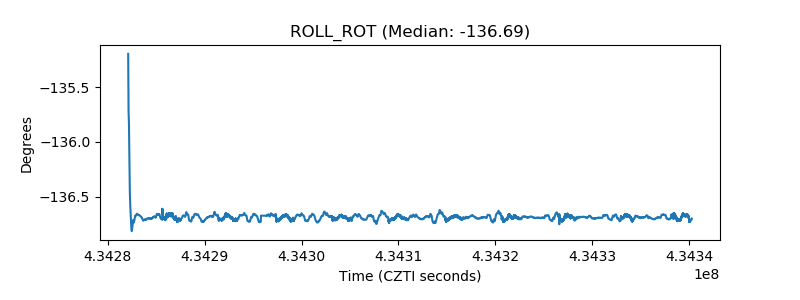 |
| _Roll_DEC |  |
| _Roll_RA |  |
| Veto Counter |  |