| Param | Original file | Final file |
|---|---|---|
| Filename | modeM0/AS1C07_001T10_9000005862cztM0_level2.fits | modeM0/AS1C07_001T10_9000005862cztM0_level2_quad_clean.evt |
| Size (bytes) | 64,022,400 | 59,472,000 |
| Size | 61.1 MB | 56.7 MB |
| Events in quadrant A | 379,570 | 332,684 |
| Events in quadrant B | 362,506 | 341,020 |
| Events in quadrant C | 370,360 | 323,601 |
| Events in quadrant D | 321,028 | 297,100 |
| Mode SS | |||
|---|---|---|---|
| Quadrant | BADHDUFLAG | Total packets | Discarded packets |
| A | 0 | 150 | 0 |
| B | 0 | 150 | 0 |
| C | 0 | 150 | 0 |
| D | 0 | 150 | 0 |
| Mode M9 | |||
|---|---|---|---|
| Quadrant | BADHDUFLAG | Total packets | Discarded packets |
| A | 0 | 27 | 0 |
| B | 0 | 27 | 0 |
| C | 0 | 27 | 0 |
| D | 0 | 27 | 0 |
| Mode M0 | |||
|---|---|---|---|
| Quadrant | BADHDUFLAG | Total packets | Discarded packets |
| A | 0 | 15972 | 0 |
| B | 0 | 14871 | 0 |
| C | 0 | 14714 | 0 |
| D | 0 | 16084 | 0 |
| Quadrant | Total seconds | Saturated seconds | Saturation percentage |
|---|---|---|---|
| A | 7262 | 62 | 0.853759% |
| B | 7262 | 11 | 0.151473% |
| C | 7262 | 7 | 0.096392% |
| D | 7262 | 55 | 0.757367% |
Noise dominated data is calculated using 1-second bins in cleaned event files. If a bin has >2000 counts, and if more than 50% of those come from <1% of pixels, then it is considered to be noise-dominated and hence unusable.
| Quadrant | # 1 sec bins | Bins with >0 counts | Bins with >2000 counts | High rate bins dominated by noise | Noise dominated (total time) | Noise dominated (detector-on time) | Marked lightcurve |
|---|---|---|---|---|---|---|---|
| A | 9055 | 7262 | 0 | 0 | 0.00% | 0.00% |  |
| B | 9055 | 7262 | 0 | 0 | 0.00% | 0.00% |  |
| C | 9055 | 7262 | 0 | 0 | 0.00% | 0.00% |  |
| D | 9055 | 7262 | 0 | 0 | 0.00% | 0.00% |  |
Top three noisy pixels from each quadrant. If the there are fewer than three noisy pixels in the level2.evt file, extra rows are filled as -1
| Pixel properties | Quadrant properties | ||||||
|---|---|---|---|---|---|---|---|
| Quadrant | DetID | PixID | Counts | Sigma | Mean | Median | Sigma |
| A | 9 | 19 | 316 | 8.08 | 99 | 93 | 27.6 |
| A | 7 | 110 | 309 | 7.83 | 99 | 93 | 27.6 |
| A | 0 | 29 | 296 | 7.36 | 99 | 93 | 27.6 |
| B | 2 | 9 | 329 | 11.65 | 95 | 91 | 20.4 |
| B | 5 | 128 | 282 | 9.35 | 95 | 91 | 20.4 |
| B | 2 | 8 | 269 | 8.71 | 95 | 91 | 20.4 |
| C | 1 | 81 | 302 | 7.93 | 97 | 91 | 26.6 |
| C | 3 | 203 | 291 | 7.51 | 97 | 91 | 26.6 |
| C | 7 | 221 | 288 | 7.4 | 97 | 91 | 26.6 |
| D | 4 | 160 | 246 | 6.12 | 91 | 83 | 26.6 |
| D | 6 | 67 | 245 | 6.09 | 91 | 83 | 26.6 |
| D | 6 | 62 | 237 | 5.79 | 91 | 83 | 26.6 |
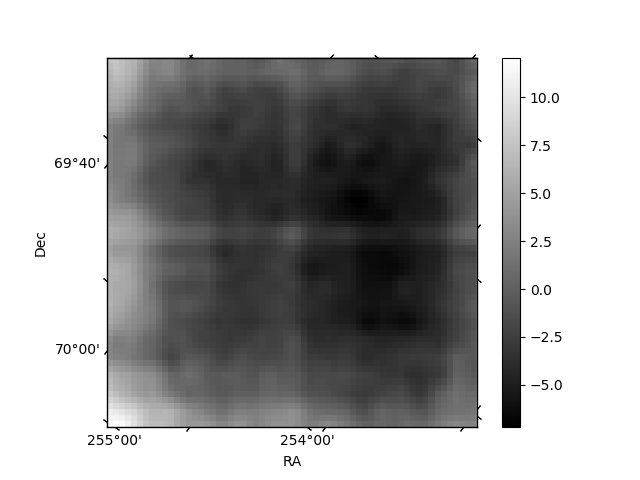
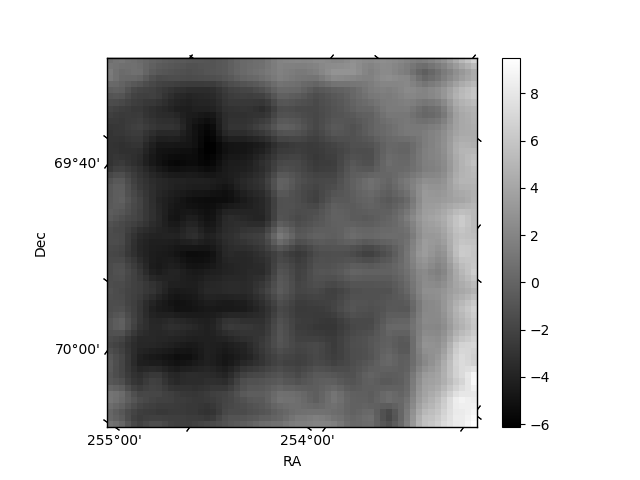
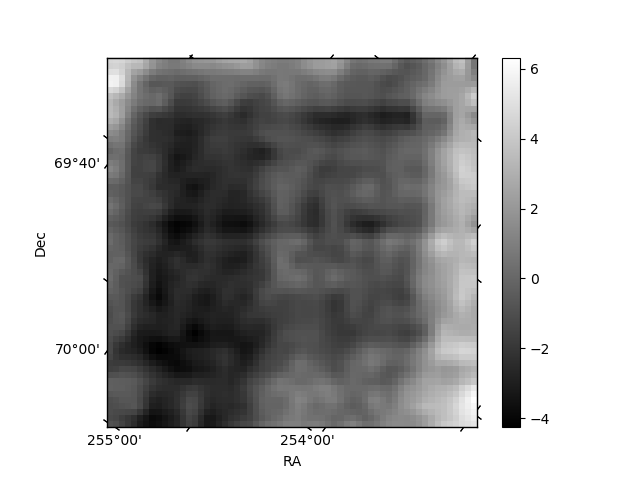
Histogram calculated using DETX and DETY for each event in the final _common_clean file
| Quadrant A |  |
 |
Quadrant B |
|---|---|---|---|
| Quadrant D |  |
 |
Quadrant C |
| Plot type | Count rate plots | Images |
|---|---|---|
| Comparison with Poisson distribution Blue bars denote a histogram of data divided into 1 sec bins. Red curve is a Poisson curve with rate = median count rate of data. |
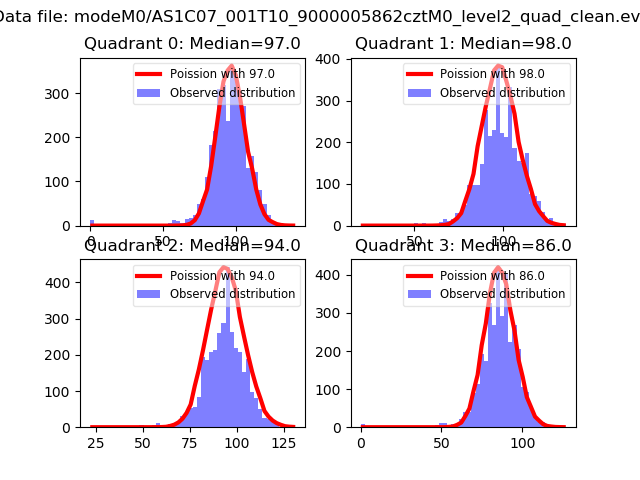 |
 |
| Quadrant-wise count rates Data is divided into 100 sec bins |
 |
|
| Module-wise count rates for Quadrant A Data is divided into 100 sec bins |
 |
 |
| Module-wise count rates for Quadrant B Data is divided into 100 sec bins |
 |
 |
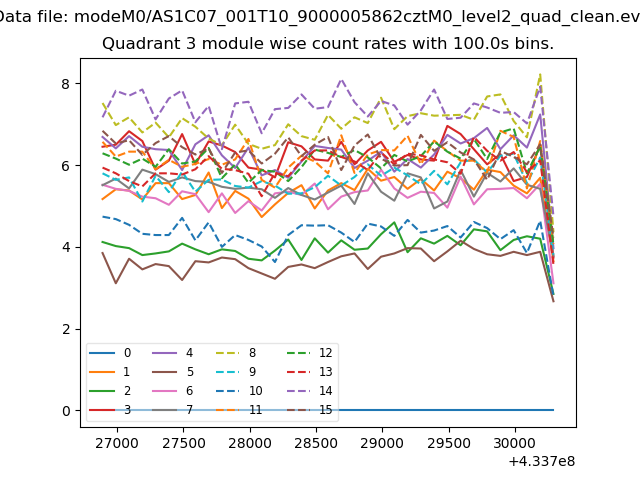
| Module-wise count rates for Quadrant C Data is divided into 100 sec bins |
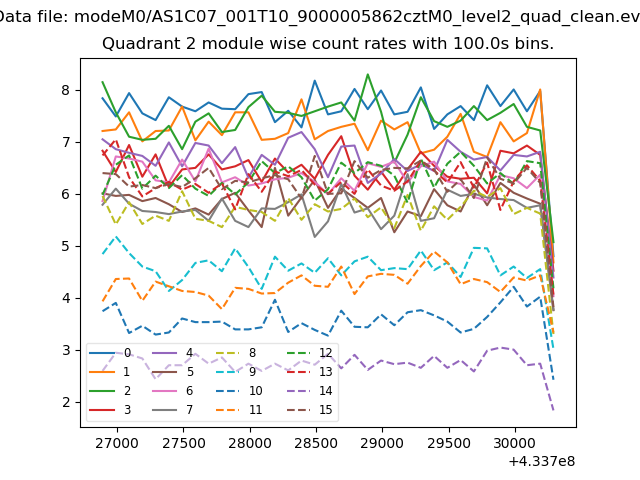 |
 |
| Module-wise count rates for Quadrant D Data is divided into 100 sec bins |
 |
 |
| Parameter | Plot |
|---|---|
| CZT HV Monitor |  |
| D_VDD |  |
| Temperature 1 |  |
| Veto HV Monitor |  |
| Veto LLD |  |
| Alpha Counter |  |
| _CPM_Rate |  |
| CZT Counter |  |
| +2.5 Volts monitor | 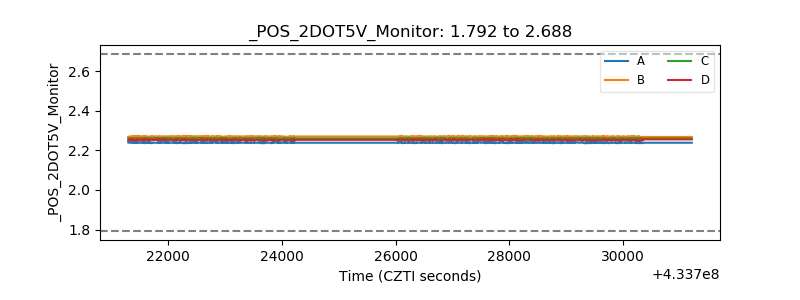 |
| +5 Volts monitor | 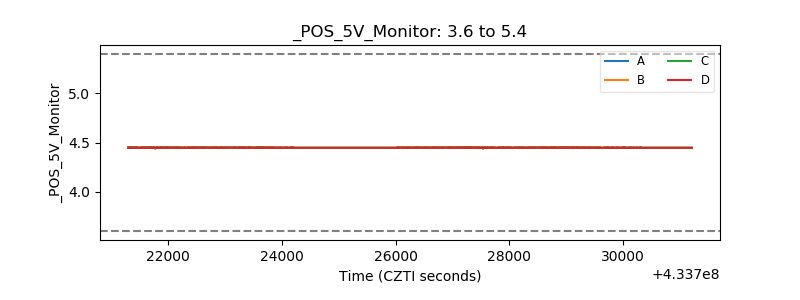 |
| _ROLL_ROT | 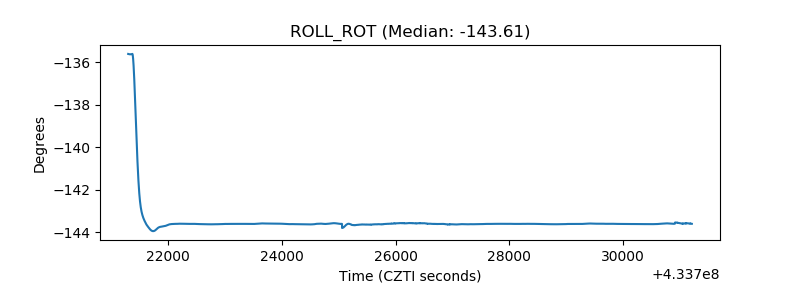 |
| _Roll_DEC |  |
| _Roll_RA |  |
| Veto Counter |  |