| Param | Original file | Final file |
|---|---|---|
| Filename | modeM0/AS1A09_107T01_9000005854cztM0_level2.fits | modeM0/AS1A09_107T01_9000005854cztM0_level2_quad_clean.evt |
| Size (bytes) | 464,906,880 | 703,656,000 |
| Size | 443.4 MB | 671.1 MB |
| Events in quadrant A | 2,680,634 | 4,451,159 |
| Events in quadrant B | 2,639,524 | 4,562,319 |
| Events in quadrant C | 2,761,570 | 4,578,133 |
| Events in quadrant D | 2,369,926 | 4,095,781 |
| Mode M0 | |||
|---|---|---|---|
| Quadrant | BADHDUFLAG | Total packets | Discarded packets |
| A | 0 | 148659 | 0 |
| B | 0 | 116548 | 0 |
| C | 0 | 108078 | 0 |
| D | 0 | 133551 | 0 |
| Mode M9 | |||
|---|---|---|---|
| Quadrant | BADHDUFLAG | Total packets | Discarded packets |
| A | 0 | 211 | 0 |
| B | 0 | 211 | 0 |
| C | 0 | 211 | 0 |
| D | 0 | 211 | 0 |
| Mode SS | |||
|---|---|---|---|
| Quadrant | BADHDUFLAG | Total packets | Discarded packets |
| A | 0 | 1084 | 0 |
| B | 0 | 1084 | 0 |
| C | 0 | 1084 | 0 |
| D | 0 | 1084 | 0 |
| Quadrant | Total seconds | Saturated seconds | Saturation percentage |
|---|---|---|---|
| A | 52838 | 2754 | 5.212158% |
| B | 52838 | 1161 | 2.197282% |
| C | 52838 | 92 | 0.174117% |
| D | 52838 | 1460 | 2.763163% |
Noise dominated data is calculated using 1-second bins in cleaned event files. If a bin has >2000 counts, and if more than 50% of those come from <1% of pixels, then it is considered to be noise-dominated and hence unusable.
| Quadrant | # 1 sec bins | Bins with >0 counts | Bins with >2000 counts | High rate bins dominated by noise | Noise dominated (total time) | Noise dominated (detector-on time) | Marked lightcurve |
|---|---|---|---|---|---|---|---|
| A | 74023 | 52616 | 0 | 0 | 0.00% | 0.00% |  |
| B | 74023 | 52452 | 0 | 0 | 0.00% | 0.00% |  |
| C | 74023 | 52836 | 0 | 0 | 0.00% | 0.00% |  |
| D | 74023 | 52826 | 0 | 0 | 0.00% | 0.00% |  |
Top three noisy pixels from each quadrant. If the there are fewer than three noisy pixels in the level2.evt file, extra rows are filled as -1
| Pixel properties | Quadrant properties | ||||||
|---|---|---|---|---|---|---|---|
| Quadrant | DetID | PixID | Counts | Sigma | Mean | Median | Sigma |
| A | 9 | 19 | 2238 | 8.95 | 700 | 660 | 176.4 |
| A | 7 | 110 | 2224 | 8.87 | 700 | 660 | 176.4 |
| A | 0 | 29 | 2160 | 8.5 | 700 | 660 | 176.4 |
| B | 2 | 9 | 2148 | 10.96 | 697 | 667 | 135.1 |
| B | 3 | 80 | 1887 | 9.03 | 697 | 667 | 135.1 |
| B | 3 | 17 | 1813 | 8.48 | 697 | 667 | 135.1 |
| C | 1 | 81 | 2307 | 8.62 | 729 | 685 | 188.2 |
| C | 3 | 202 | 2296 | 8.56 | 729 | 685 | 188.2 |
| C | 3 | 203 | 2253 | 8.33 | 729 | 685 | 188.2 |
| D | 10 | 189 | 1820 | 6.56 | 679 | 621 | 182.7 |
| D | 7 | 3 | 1805 | 6.48 | 679 | 621 | 182.7 |
| D | 4 | 160 | 1765 | 6.26 | 679 | 621 | 182.7 |
Histogram calculated using DETX and DETY for each event in the final _common_clean file
| Quadrant A |  |
 |
Quadrant B |
|---|---|---|---|
| Quadrant D | 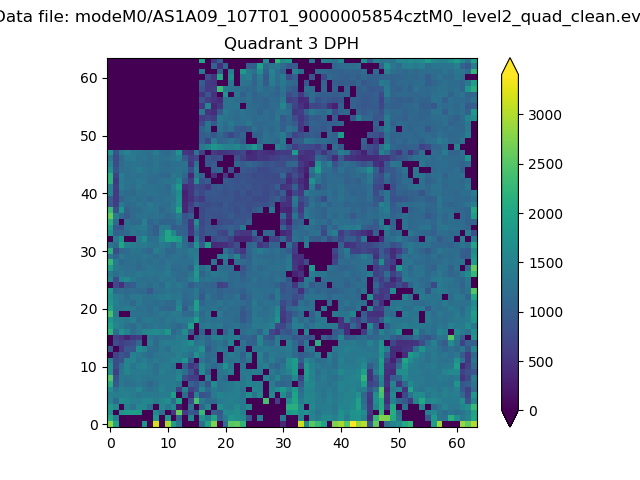 |
 |
Quadrant C |
| Plot type | Count rate plots | Images |
|---|---|---|
| Comparison with Poisson distribution Blue bars denote a histogram of data divided into 1 sec bins. Red curve is a Poisson curve with rate = median count rate of data. |
 |
 |
| Quadrant-wise count rates Data is divided into 100 sec bins |
 |
|
| Module-wise count rates for Quadrant A Data is divided into 100 sec bins |
 |
 |
| Module-wise count rates for Quadrant B Data is divided into 100 sec bins |
 |
 |
| Module-wise count rates for Quadrant C Data is divided into 100 sec bins |
 |
 |
| Module-wise count rates for Quadrant D Data is divided into 100 sec bins |
 |
 |
| Parameter | Plot |
|---|---|
| CZT HV Monitor |  |
| D_VDD |  |
| Temperature 1 |  |
| Veto HV Monitor |  |
| Veto LLD |  |
| Alpha Counter |  |
| _CPM_Rate |  |
| CZT Counter |  |
| +2.5 Volts monitor |  |
| +5 Volts monitor | 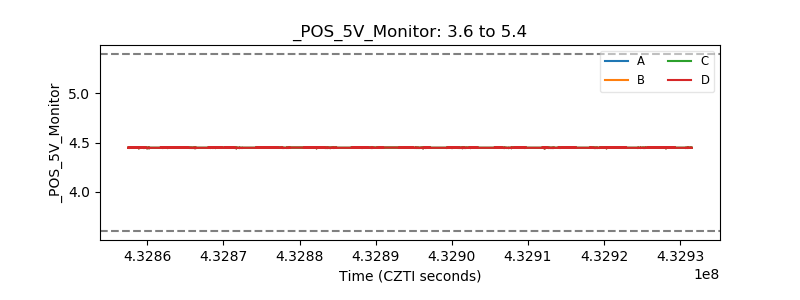 |
| _ROLL_ROT | 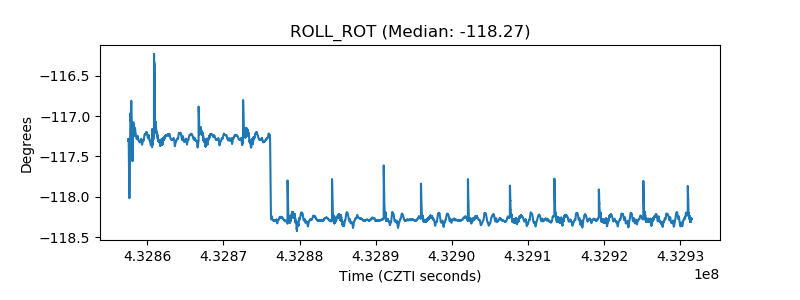 |
| _Roll_DEC |  |
| _Roll_RA |  |
| Veto Counter | 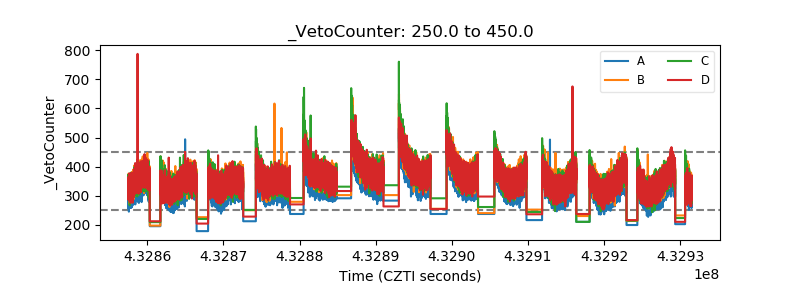 |