| Param | Original file | Final file |
|---|---|---|
| Filename | modeM0/AS1T05_154T01_9000005850cztM0_level2.fits | modeM0/AS1T05_154T01_9000005850cztM0_level2_quad_clean.evt |
| Size (bytes) | 590,483,520 | 945,918,720 |
| Size | 563.1 MB | 902.1 MB |
| Events in quadrant A | 3,402,624 | 6,010,424 |
| Events in quadrant B | 3,399,944 | 6,382,527 |
| Events in quadrant C | 3,462,380 | 6,103,232 |
| Events in quadrant D | 2,984,160 | 5,525,051 |
| Mode M0 | |||
|---|---|---|---|
| Quadrant | BADHDUFLAG | Total packets | Discarded packets |
| A | 0 | 194044 | 0 |
| B | 0 | 138631 | 0 |
| C | 0 | 141348 | 0 |
| D | 0 | 175995 | 0 |
| Mode SS | |||
|---|---|---|---|
| Quadrant | BADHDUFLAG | Total packets | Discarded packets |
| A | 0 | 1382 | 0 |
| B | 0 | 1382 | 0 |
| C | 0 | 1382 | 0 |
| D | 0 | 1382 | 0 |
| Mode M9 | |||
|---|---|---|---|
| Quadrant | BADHDUFLAG | Total packets | Discarded packets |
| A | 0 | 259 | 0 |
| B | 0 | 259 | 0 |
| C | 0 | 259 | 0 |
| D | 0 | 259 | 0 |
| Quadrant | Total seconds | Saturated seconds | Saturation percentage |
|---|---|---|---|
| A | 67517 | 5222 | 7.734348% |
| B | 67517 | 223 | 0.330287% |
| C | 67517 | 145 | 0.214761% |
| D | 67517 | 2238 | 3.314721% |
Noise dominated data is calculated using 1-second bins in cleaned event files. If a bin has >2000 counts, and if more than 50% of those come from <1% of pixels, then it is considered to be noise-dominated and hence unusable.
| Quadrant | # 1 sec bins | Bins with >0 counts | Bins with >2000 counts | High rate bins dominated by noise | Noise dominated (total time) | Noise dominated (detector-on time) | Marked lightcurve |
|---|---|---|---|---|---|---|---|
| A | 93484 | 67306 | 0 | 0 | 0.00% | 0.00% |  |
| B | 93485 | 67516 | 0 | 0 | 0.00% | 0.00% |  |
| C | 93485 | 67517 | 0 | 0 | 0.00% | 0.00% |  |
| D | 93485 | 67482 | 0 | 0 | 0.00% | 0.00% |  |
Top three noisy pixels from each quadrant. If the there are fewer than three noisy pixels in the level2.evt file, extra rows are filled as -1
| Pixel properties | Quadrant properties | ||||||
|---|---|---|---|---|---|---|---|
| Quadrant | DetID | PixID | Counts | Sigma | Mean | Median | Sigma |
| A | 9 | 19 | 2914 | 9.32 | 888 | 837 | 222.9 |
| A | 0 | 29 | 2789 | 8.76 | 888 | 837 | 222.9 |
| A | 7 | 110 | 2739 | 8.53 | 888 | 837 | 222.9 |
| B | 2 | 9 | 3039 | 12.53 | 897 | 859 | 174.0 |
| B | 2 | 8 | 2504 | 9.45 | 897 | 859 | 174.0 |
| B | 3 | 80 | 2460 | 9.2 | 897 | 859 | 174.0 |
| C | 1 | 81 | 2955 | 8.89 | 915 | 854 | 236.4 |
| C | 1 | 80 | 2757 | 8.05 | 915 | 854 | 236.4 |
| C | 3 | 203 | 2707 | 7.84 | 915 | 854 | 236.4 |
| D | 10 | 189 | 2297 | 6.61 | 853 | 777 | 229.8 |
| D | 6 | 62 | 2155 | 6.0 | 853 | 777 | 229.8 |
| D | 4 | 160 | 2155 | 6.0 | 853 | 777 | 229.8 |
Histogram calculated using DETX and DETY for each event in the final _common_clean file
| Quadrant A |  |
 |
Quadrant B |
|---|---|---|---|
| Quadrant D |  |
 |
Quadrant C |
| Plot type | Count rate plots | Images |
|---|---|---|
| Comparison with Poisson distribution Blue bars denote a histogram of data divided into 1 sec bins. Red curve is a Poisson curve with rate = median count rate of data. |
 |
 |
| Quadrant-wise count rates Data is divided into 100 sec bins |
 |
|
| Module-wise count rates for Quadrant A Data is divided into 100 sec bins |
 |
 |
| Module-wise count rates for Quadrant B Data is divided into 100 sec bins |
 |
 |
| Module-wise count rates for Quadrant C Data is divided into 100 sec bins |
 |
 |
| Module-wise count rates for Quadrant D Data is divided into 100 sec bins |
 |
 |
| Parameter | Plot |
|---|---|
| CZT HV Monitor |  |
| D_VDD |  |
| Temperature 1 |  |
| Veto HV Monitor |  |
| Veto LLD |  |
| Alpha Counter |  |
| _CPM_Rate |  |
| CZT Counter |  |
| +2.5 Volts monitor |  |
| +5 Volts monitor |  |
| _ROLL_ROT |  |
| _Roll_DEC |  |
| _Roll_RA |  |
| Veto Counter | 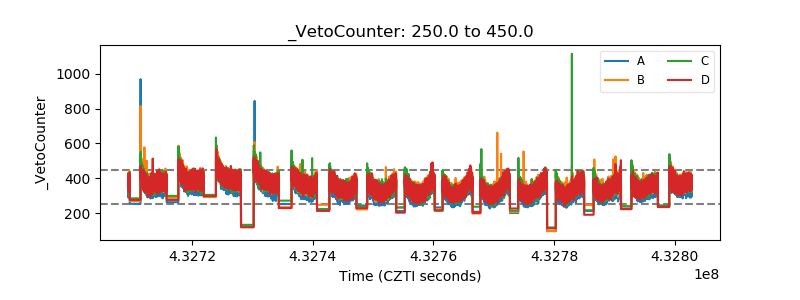 |