| Param | Original file | Final file |
|---|---|---|
| Filename | modeM0/AS1T05_153T01_9000005848cztM0_level2.fits | modeM0/AS1T05_153T01_9000005848cztM0_level2_quad_clean.evt |
| Size (bytes) | 516,182,400 | 783,984,960 |
| Size | 492.3 MB | 747.7 MB |
| Events in quadrant A | 3,058,248 | 5,126,041 |
| Events in quadrant B | 2,943,026 | 5,147,550 |
| Events in quadrant C | 3,000,168 | 4,934,187 |
| Events in quadrant D | 2,628,078 | 4,536,957 |
| Mode SS | |||
|---|---|---|---|
| Quadrant | BADHDUFLAG | Total packets | Discarded packets |
| A | 0 | 1192 | 0 |
| B | 0 | 1192 | 0 |
| C | 0 | 1192 | 0 |
| D | 0 | 1192 | 0 |
| Mode M9 | |||
|---|---|---|---|
| Quadrant | BADHDUFLAG | Total packets | Discarded packets |
| A | 0 | 204 | 0 |
| B | 0 | 204 | 0 |
| C | 0 | 204 | 0 |
| D | 0 | 204 | 0 |
| Mode M0 | |||
|---|---|---|---|
| Quadrant | BADHDUFLAG | Total packets | Discarded packets |
| A | 0 | 145066 | 0 |
| B | 0 | 124964 | 0 |
| C | 0 | 125192 | 0 |
| D | 0 | 135324 | 0 |
| Quadrant | Total seconds | Saturated seconds | Saturation percentage |
|---|---|---|---|
| A | 58339 | 1680 | 2.879720% |
| B | 58339 | 379 | 0.649651% |
| C | 58339 | 399 | 0.683934% |
| D | 58339 | 1069 | 1.832393% |
Noise dominated data is calculated using 1-second bins in cleaned event files. If a bin has >2000 counts, and if more than 50% of those come from <1% of pixels, then it is considered to be noise-dominated and hence unusable.
| Quadrant | # 1 sec bins | Bins with >0 counts | Bins with >2000 counts | High rate bins dominated by noise | Noise dominated (total time) | Noise dominated (detector-on time) | Marked lightcurve |
|---|---|---|---|---|---|---|---|
| A | 78778 | 58290 | 0 | 0 | 0.00% | 0.00% |  |
| B | 78778 | 58338 | 0 | 0 | 0.00% | 0.00% | 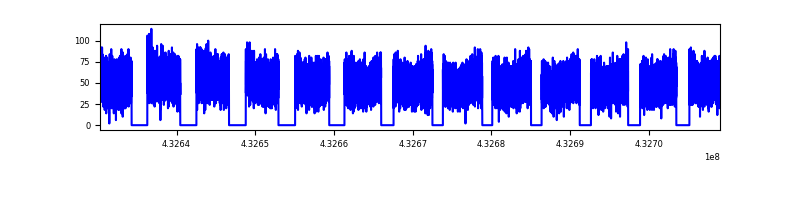 |
| C | 78778 | 58332 | 0 | 0 | 0.00% | 0.00% |  |
| D | 78778 | 58308 | 0 | 0 | 0.00% | 0.00% |  |
Top three noisy pixels from each quadrant. If the there are fewer than three noisy pixels in the level2.evt file, extra rows are filled as -1
| Pixel properties | Quadrant properties | ||||||
|---|---|---|---|---|---|---|---|
| Quadrant | DetID | PixID | Counts | Sigma | Mean | Median | Sigma |
| A | 9 | 19 | 2548 | 8.9 | 798 | 750 | 202.1 |
| A | 7 | 110 | 2504 | 8.68 | 798 | 750 | 202.1 |
| A | 0 | 29 | 2489 | 8.61 | 798 | 750 | 202.1 |
| B | 2 | 9 | 2556 | 12.02 | 777 | 743 | 150.9 |
| B | 3 | 80 | 2192 | 9.6 | 777 | 743 | 150.9 |
| B | 2 | 8 | 2105 | 9.03 | 777 | 743 | 150.9 |
| C | 1 | 81 | 2492 | 8.59 | 793 | 743 | 203.5 |
| C | 3 | 202 | 2400 | 8.14 | 793 | 743 | 203.5 |
| C | 3 | 203 | 2378 | 8.03 | 793 | 743 | 203.5 |
| D | 6 | 38 | 1979 | 6.38 | 751 | 683 | 203.0 |
| D | 3 | 14 | 1972 | 6.35 | 751 | 683 | 203.0 |
| D | 7 | 3 | 1971 | 6.34 | 751 | 683 | 203.0 |
Histogram calculated using DETX and DETY for each event in the final _common_clean file
| Quadrant A | 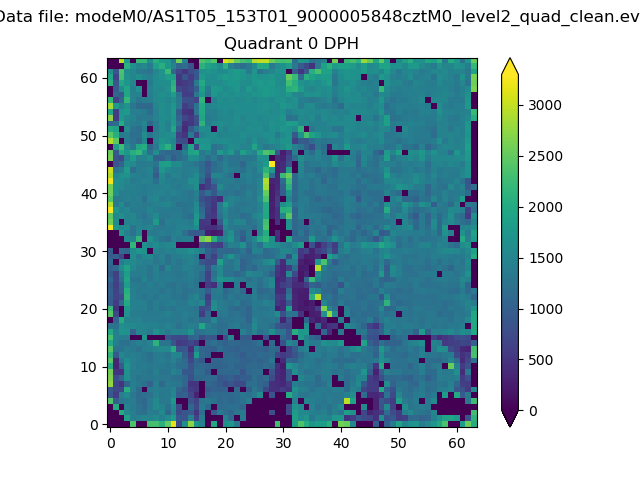 |
 |
Quadrant B |
|---|---|---|---|
| Quadrant D |  |
 |
Quadrant C |
| Plot type | Count rate plots | Images |
|---|---|---|
| Comparison with Poisson distribution Blue bars denote a histogram of data divided into 1 sec bins. Red curve is a Poisson curve with rate = median count rate of data. |
 |
 |
| Quadrant-wise count rates Data is divided into 100 sec bins |
 |
|
| Module-wise count rates for Quadrant A Data is divided into 100 sec bins |
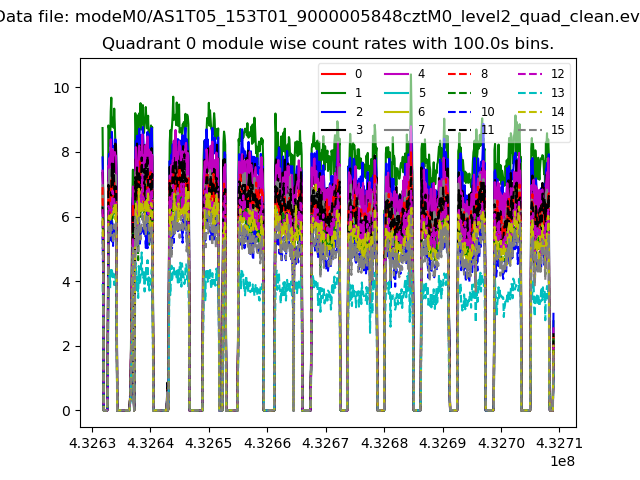 |
 |
| Module-wise count rates for Quadrant B Data is divided into 100 sec bins |
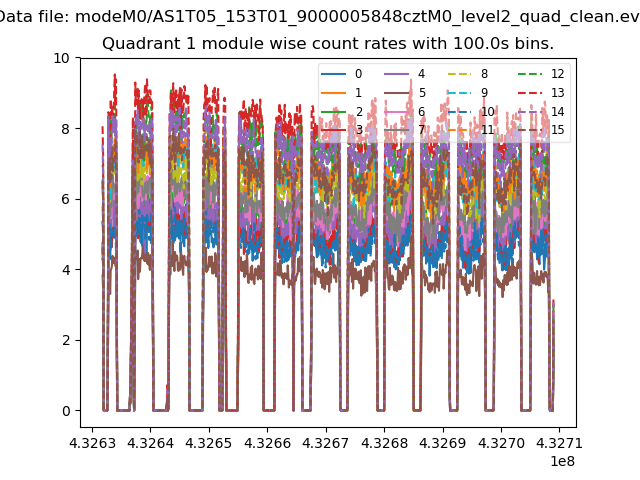 |
 |
| Module-wise count rates for Quadrant C Data is divided into 100 sec bins |
 |
 |
| Module-wise count rates for Quadrant D Data is divided into 100 sec bins |
 |
 |
| Parameter | Plot |
|---|---|
| CZT HV Monitor |  |
| D_VDD |  |
| Temperature 1 | 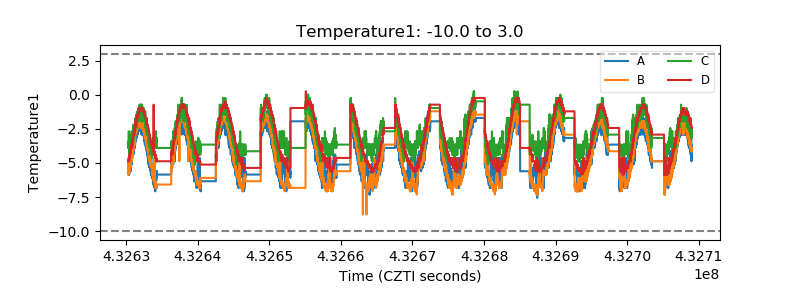 |
| Veto HV Monitor | 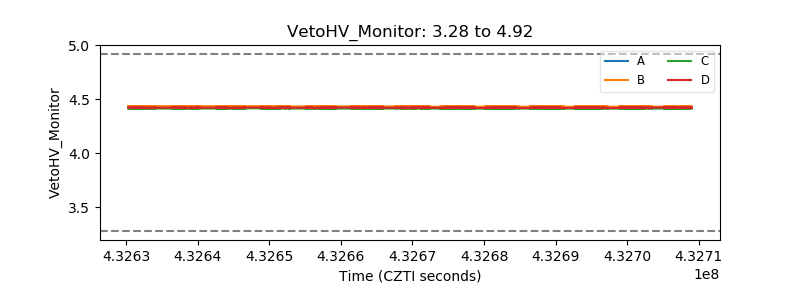 |
| Veto LLD |  |
| Alpha Counter | 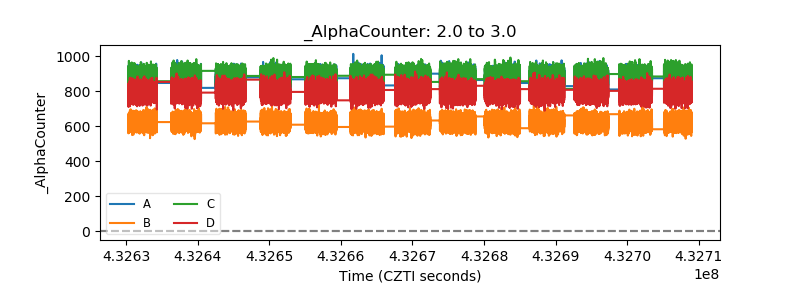 |
| _CPM_Rate |  |
| CZT Counter |  |
| +2.5 Volts monitor |  |
| +5 Volts monitor |  |
| _ROLL_ROT |  |
| _Roll_DEC |  |
| _Roll_RA |  |
| Veto Counter |  |