| Param | Original file | Final file |
|---|---|---|
| Filename | modeM0/AS1T05_152T01_9000005846cztM0_level2.fits | modeM0/AS1T05_152T01_9000005846cztM0_level2_quad_clean.evt |
| Size (bytes) | 436,389,120 | 657,835,200 |
| Size | 416.2 MB | 627.4 MB |
| Events in quadrant A | 2,582,400 | 4,289,743 |
| Events in quadrant B | 2,474,010 | 4,274,301 |
| Events in quadrant C | 2,554,376 | 4,171,601 |
| Events in quadrant D | 2,195,952 | 3,781,339 |
| Mode M0 | |||
|---|---|---|---|
| Quadrant | BADHDUFLAG | Total packets | Discarded packets |
| A | 0 | 117980 | 0 |
| B | 0 | 111089 | 0 |
| C | 0 | 102135 | 0 |
| D | 0 | 121118 | 0 |
| Mode SS | |||
|---|---|---|---|
| Quadrant | BADHDUFLAG | Total packets | Discarded packets |
| A | 0 | 1016 | 0 |
| B | 0 | 1016 | 0 |
| C | 0 | 1016 | 0 |
| D | 0 | 1016 | 0 |
| Mode M9 | |||
|---|---|---|---|
| Quadrant | BADHDUFLAG | Total packets | Discarded packets |
| A | 0 | 202 | 0 |
| B | 0 | 201 | 0 |
| C | 0 | 201 | 0 |
| D | 0 | 201 | 0 |
| Quadrant | Total seconds | Saturated seconds | Saturation percentage |
|---|---|---|---|
| A | 49671 | 906 | 1.824002% |
| B | 49678 | 661 | 1.330569% |
| C | 49676 | 123 | 0.247604% |
| D | 49675 | 1587 | 3.194766% |
Noise dominated data is calculated using 1-second bins in cleaned event files. If a bin has >2000 counts, and if more than 50% of those come from <1% of pixels, then it is considered to be noise-dominated and hence unusable.
| Quadrant | # 1 sec bins | Bins with >0 counts | Bins with >2000 counts | High rate bins dominated by noise | Noise dominated (total time) | Noise dominated (detector-on time) | Marked lightcurve |
|---|---|---|---|---|---|---|---|
| A | 70658 | 49553 | 0 | 0 | 0.00% | 0.00% |  |
| B | 70658 | 49682 | 0 | 0 | 0.00% | 0.00% |  |
| C | 70658 | 49679 | 0 | 0 | 0.00% | 0.00% |  |
| D | 70658 | 49648 | 0 | 0 | 0.00% | 0.00% |  |
Top three noisy pixels from each quadrant. If the there are fewer than three noisy pixels in the level2.evt file, extra rows are filled as -1
| Pixel properties | Quadrant properties | ||||||
|---|---|---|---|---|---|---|---|
| Quadrant | DetID | PixID | Counts | Sigma | Mean | Median | Sigma |
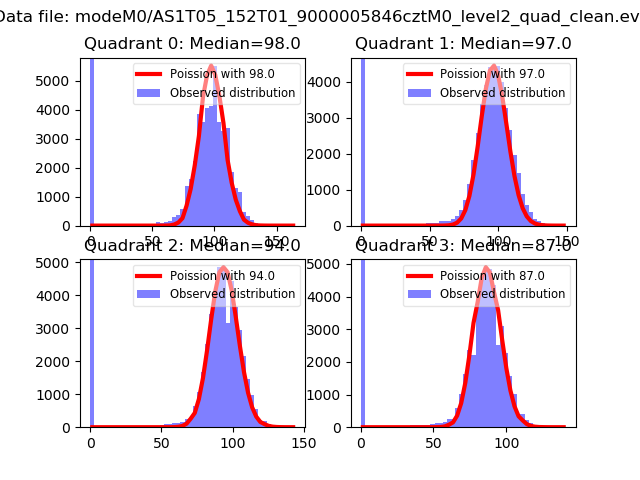
| A | 0 | 29 | 2206 | 9.27 | 673 | 633 | 169.7 |
| A | 9 | 19 | 2141 | 8.88 | 673 | 633 | 169.7 |
| A | 7 | 110 | 2120 | 8.76 | 673 | 633 | 169.7 |
| B | 2 | 9 | 2215 | 12.25 | 654 | 624 | 129.9 |
| B | 3 | 80 | 1803 | 9.08 | 654 | 624 | 129.9 |
| B | 2 | 8 | 1784 | 8.93 | 654 | 624 | 129.9 |
| C | 1 | 81 | 2093 | 8.41 | 674 | 631 | 173.9 |
| C | 3 | 203 | 2041 | 8.11 | 674 | 631 | 173.9 |
| C | 3 | 202 | 1989 | 7.81 | 674 | 631 | 173.9 |
| D | 10 | 189 | 1621 | 6.2 | 627 | 571 | 169.3 |
| D | 7 | 3 | 1619 | 6.19 | 627 | 571 | 169.3 |
| D | 3 | 14 | 1618 | 6.18 | 627 | 571 | 169.3 |
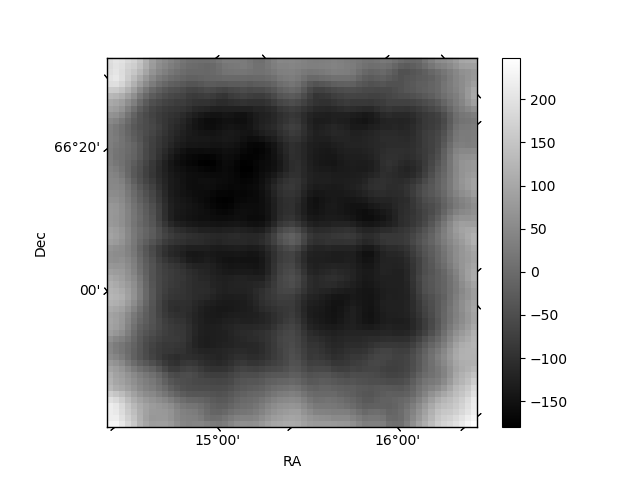
Histogram calculated using DETX and DETY for each event in the final _common_clean file
| Quadrant A |  |
 |
Quadrant B |
|---|---|---|---|
| Quadrant D |  |
 |
Quadrant C |
| Plot type | Count rate plots | Images |
|---|---|---|
| Comparison with Poisson distribution Blue bars denote a histogram of data divided into 1 sec bins. Red curve is a Poisson curve with rate = median count rate of data. |
 |
 |
| Quadrant-wise count rates Data is divided into 100 sec bins |
 |
|
| Module-wise count rates for Quadrant A Data is divided into 100 sec bins |
 |
 |
| Module-wise count rates for Quadrant B Data is divided into 100 sec bins |
 |
 |
| Module-wise count rates for Quadrant C Data is divided into 100 sec bins |
 |
 |
| Module-wise count rates for Quadrant D Data is divided into 100 sec bins |
 |
 |
| Parameter | Plot |
|---|---|
| CZT HV Monitor |  |
| D_VDD |  |
| Temperature 1 |  |
| Veto HV Monitor |  |
| Veto LLD |  |
| Alpha Counter |  |
| _CPM_Rate |  |
| CZT Counter | 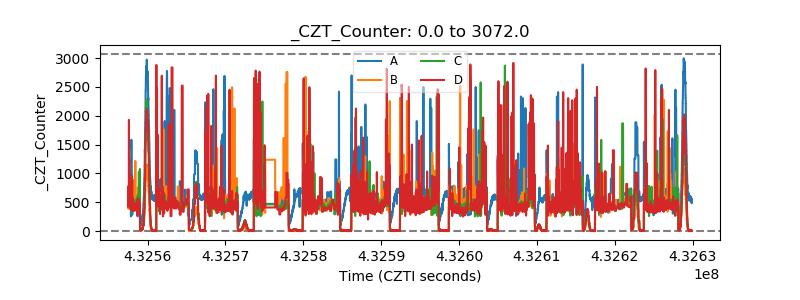 |
| +2.5 Volts monitor |  |
| +5 Volts monitor |  |
| _ROLL_ROT |  |
| _Roll_DEC |  |
| _Roll_RA |  |
| Veto Counter |  |