| Param | Original file | Final file |
|---|---|---|
| Filename | modeM0/AS1A05_174T01_9000005820cztM0_level2.fits | modeM0/AS1A05_174T01_9000005820cztM0_level2_quad_clean.evt |
| Size (bytes) | 1,582,326,720 | 1,552,138,560 |
| Size | 1.5 GB | 1.4 GB |
| Events in quadrant A | 9,461,288 | 9,151,669 |
| Events in quadrant B | 9,112,002 | 9,196,764 |
| Events in quadrant C | 9,423,236 | 8,827,007 |
| Events in quadrant D | 7,905,040 | 7,816,623 |
| Mode M9 | |||
|---|---|---|---|
| Quadrant | BADHDUFLAG | Total packets | Discarded packets |
| A | 0 | 674 | 0 |
| B | 0 | 674 | 0 |
| C | 0 | 674 | 0 |
| D | 0 | 673 | 0 |
| Mode SS | |||
|---|---|---|---|
| Quadrant | BADHDUFLAG | Total packets | Discarded packets |
| A | 0 | 3522 | 0 |
| B | 0 | 3522 | 0 |
| C | 0 | 3522 | 0 |
| D | 0 | 3522 | 0 |
| Mode M0 | |||
|---|---|---|---|
| Quadrant | BADHDUFLAG | Total packets | Discarded packets |
| A | 0 | 399895 | 0 |
| B | 0 | 370103 | 0 |
| C | 0 | 363584 | 0 |
| D | 0 | 487153 | 0 |
| Quadrant | Total seconds | Saturated seconds | Saturation percentage |
|---|---|---|---|
| A | 175616 | 1564 | 0.890579% |
| B | 175618 | 1363 | 0.776116% |
| C | 175619 | 504 | 0.286985% |
| D | 175619 | 10674 | 6.077930% |
Noise dominated data is calculated using 1-second bins in cleaned event files. If a bin has >2000 counts, and if more than 50% of those come from <1% of pixels, then it is considered to be noise-dominated and hence unusable.
| Quadrant | # 1 sec bins | Bins with >0 counts | Bins with >2000 counts | High rate bins dominated by noise | Noise dominated (total time) | Noise dominated (detector-on time) | Marked lightcurve |
|---|---|---|---|---|---|---|---|
| A | 242904 | 175623 | 0 | 0 | 0.00% | 0.00% | 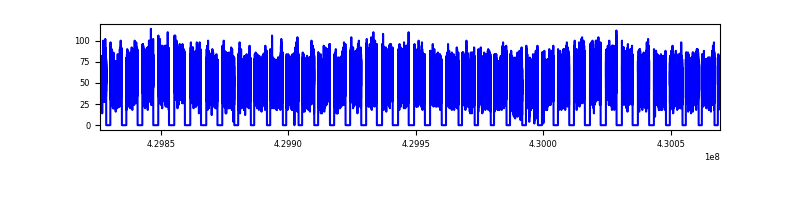 |
| B | 242904 | 175619 | 0 | 0 | 0.00% | 0.00% |  |
| C | 242904 | 175617 | 0 | 0 | 0.00% | 0.00% |  |
| D | 242904 | 175448 | 0 | 0 | 0.00% | 0.00% |  |
Top three noisy pixels from each quadrant. If the there are fewer than three noisy pixels in the level2.evt file, extra rows are filled as -1
| Pixel properties | Quadrant properties | ||||||
|---|---|---|---|---|---|---|---|
| Quadrant | DetID | PixID | Counts | Sigma | Mean | Median | Sigma |
| A | 7 | 110 | 7804 | 8.87 | 2468 | 2300 | 620.2 |
| A | 0 | 29 | 7669 | 8.66 | 2468 | 2300 | 620.2 |
| A | 9 | 19 | 7647 | 8.62 | 2468 | 2300 | 620.2 |
| B | 2 | 9 | 8039 | 12.29 | 2406 | 2283 | 468.5 |
| B | 3 | 80 | 6601 | 9.22 | 2406 | 2283 | 468.5 |
| B | 2 | 8 | 6416 | 8.82 | 2406 | 2283 | 468.5 |
| C | 1 | 81 | 7615 | 8.27 | 2492 | 2333 | 638.6 |
| C | 3 | 203 | 7362 | 7.88 | 2492 | 2333 | 638.6 |
| C | 3 | 202 | 7356 | 7.87 | 2492 | 2333 | 638.6 |
| D | 4 | 160 | 5965 | 6.49 | 2266 | 2062 | 601.8 |
| D | 10 | 189 | 5850 | 6.29 | 2266 | 2062 | 601.8 |
| D | 7 | 3 | 5825 | 6.25 | 2266 | 2062 | 601.8 |
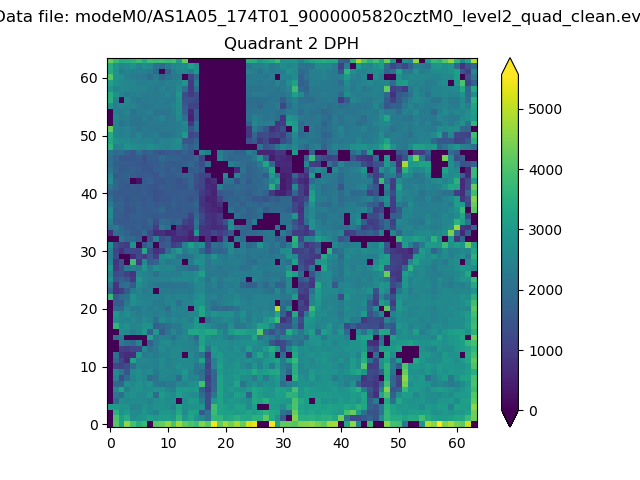
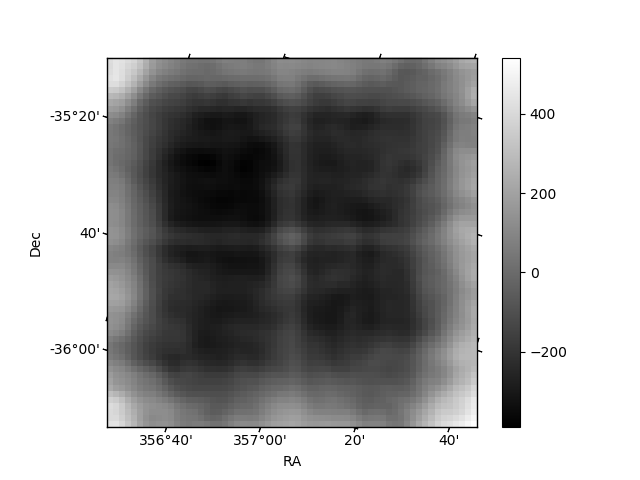
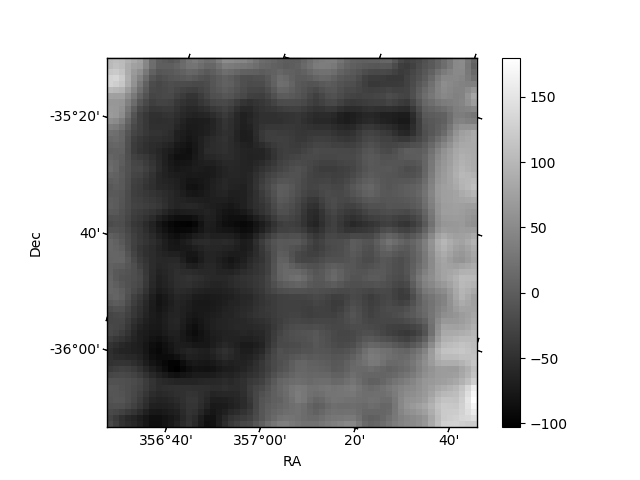
Histogram calculated using DETX and DETY for each event in the final _common_clean file
| Quadrant A | 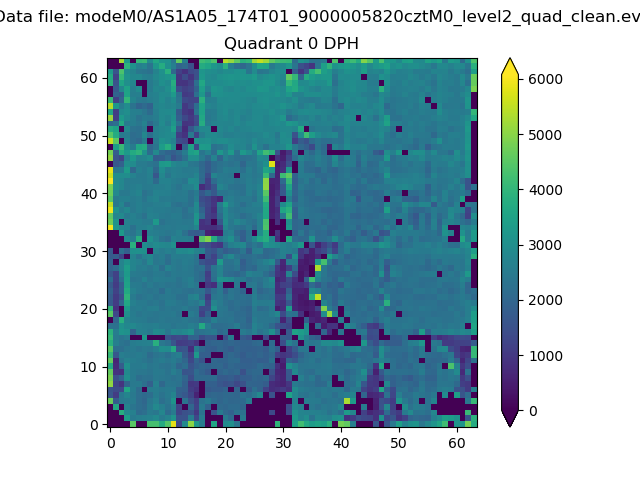 |
 |
Quadrant B |
|---|---|---|---|
| Quadrant D | 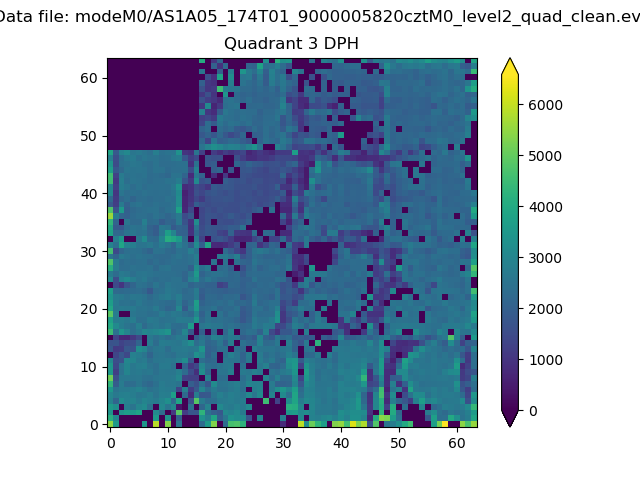 |
 |
Quadrant C |
| Plot type | Count rate plots | Images |
|---|---|---|
| Comparison with Poisson distribution Blue bars denote a histogram of data divided into 1 sec bins. Red curve is a Poisson curve with rate = median count rate of data. |
 |
 |
| Quadrant-wise count rates Data is divided into 100 sec bins |
 |
|
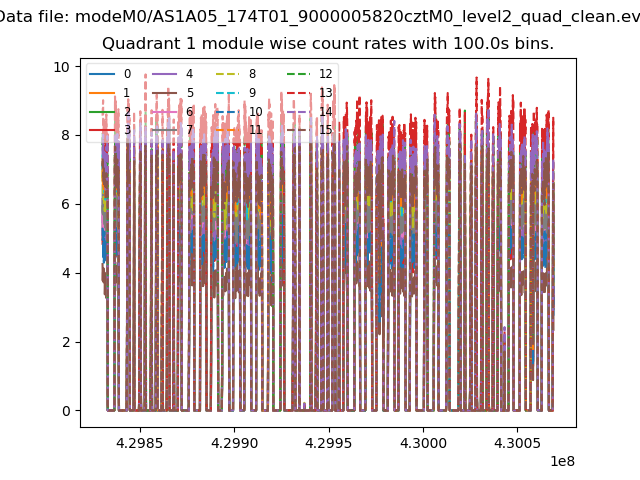
| Module-wise count rates for Quadrant A Data is divided into 100 sec bins |
 |
 |
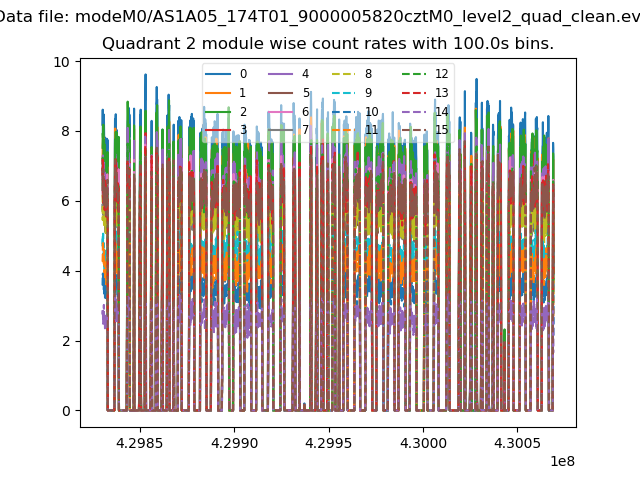
| Module-wise count rates for Quadrant B Data is divided into 100 sec bins |
 |
 |
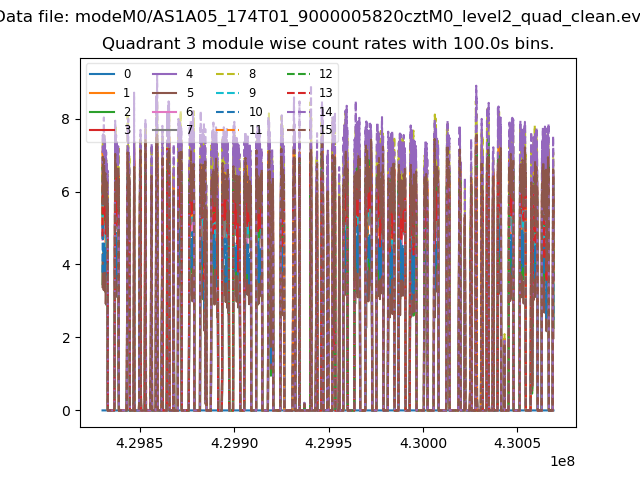
| Module-wise count rates for Quadrant C Data is divided into 100 sec bins |
 |
 |
| Module-wise count rates for Quadrant D Data is divided into 100 sec bins |
 |
 |
| Parameter | Plot |
|---|---|
| CZT HV Monitor |  |
| D_VDD | 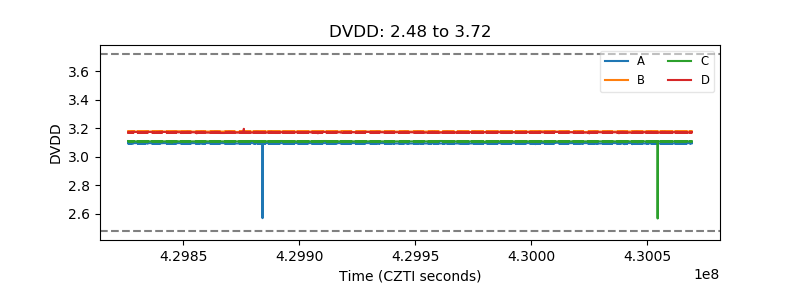 |
| Temperature 1 |  |
| Veto HV Monitor |  |
| Veto LLD |  |
| Alpha Counter |  |
| _CPM_Rate |  |
| CZT Counter | 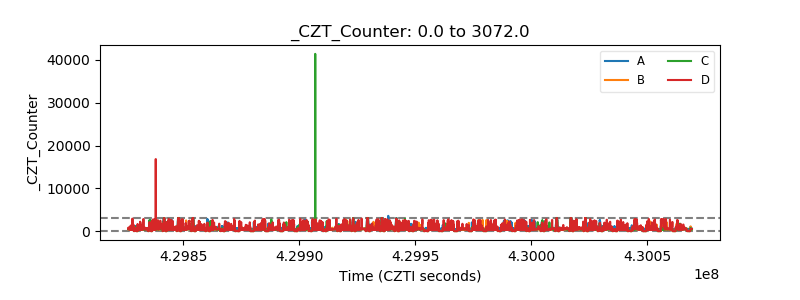 |
| +2.5 Volts monitor |  |
| +5 Volts monitor |  |
| _ROLL_ROT |  |
| _Roll_DEC |  |
| _Roll_RA |  |
| Veto Counter | 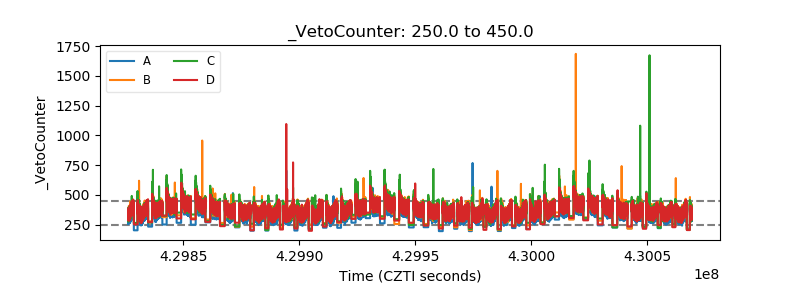 |