| Param | Original file | Final file |
|---|---|---|
| Filename | modeM0/AS1A12_061T07_9000005818cztM0_level2.fits | modeM0/AS1A12_061T07_9000005818cztM0_level2_quad_clean.evt |
| Size (bytes) | 1,223,645,760 | 1,362,378,240 |
| Size | 1.1 GB | 1.3 GB |
| Events in quadrant A | 7,282,696 | 8,333,223 |
| Events in quadrant B | 6,971,410 | 8,381,976 |
| Events in quadrant C | 7,166,860 | 7,920,083 |
| Events in quadrant D | 6,135,006 | 7,127,059 |
| Mode M0 | |||
|---|---|---|---|
| Quadrant | BADHDUFLAG | Total packets | Discarded packets |
| A | 0 | 295390 | 0 |
| B | 0 | 288772 | 0 |
| C | 0 | 298578 | 0 |
| D | 0 | 363897 | 0 |
| Mode SS | |||
|---|---|---|---|
| Quadrant | BADHDUFLAG | Total packets | Discarded packets |
| A | 0 | 2836 | 0 |
| B | 0 | 2836 | 0 |
| C | 0 | 2836 | 0 |
| D | 0 | 2836 | 0 |
| Mode M9 | |||
|---|---|---|---|
| Quadrant | BADHDUFLAG | Total packets | Discarded packets |
| A | 0 | 485 | 0 |
| B | 0 | 486 | 0 |
| C | 0 | 487 | 0 |
| D | 0 | 487 | 0 |
| Quadrant | Total seconds | Saturated seconds | Saturation percentage |
|---|---|---|---|
| A | 138644 | 281 | 0.202677% |
| B | 138645 | 647 | 0.466659% |
| C | 138646 | 743 | 0.535897% |
| D | 138644 | 5279 | 3.807594% |
Noise dominated data is calculated using 1-second bins in cleaned event files. If a bin has >2000 counts, and if more than 50% of those come from <1% of pixels, then it is considered to be noise-dominated and hence unusable.
| Quadrant | # 1 sec bins | Bins with >0 counts | Bins with >2000 counts | High rate bins dominated by noise | Noise dominated (total time) | Noise dominated (detector-on time) | Marked lightcurve |
|---|---|---|---|---|---|---|---|
| A | 201901 | 138642 | 0 | 0 | 0.00% | 0.00% |  |
| B | 201901 | 138643 | 0 | 0 | 0.00% | 0.00% | 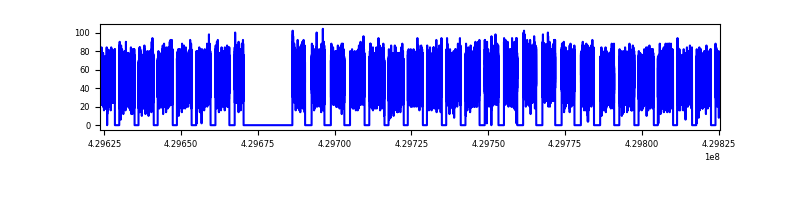 |
| C | 201901 | 138642 | 0 | 0 | 0.00% | 0.00% |  |
| D | 201901 | 138387 | 0 | 0 | 0.00% | 0.00% | 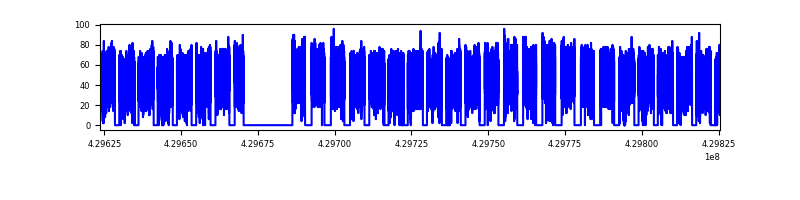 |
Top three noisy pixels from each quadrant. If the there are fewer than three noisy pixels in the level2.evt file, extra rows are filled as -1
| Pixel properties | Quadrant properties | ||||||
|---|---|---|---|---|---|---|---|
| Quadrant | DetID | PixID | Counts | Sigma | Mean | Median | Sigma |
| A | 7 | 110 | 6086 | 8.94 | 1900 | 1769 | 482.9 |
| A | 0 | 29 | 5944 | 8.65 | 1900 | 1769 | 482.9 |
| A | 9 | 19 | 5808 | 8.36 | 1900 | 1769 | 482.9 |
| B | 2 | 9 | 6071 | 12.14 | 1843 | 1751 | 355.8 |
| B | 3 | 80 | 4945 | 8.98 | 1843 | 1751 | 355.8 |
| B | 5 | 128 | 4911 | 8.88 | 1843 | 1751 | 355.8 |
| C | 1 | 81 | 6003 | 8.81 | 1894 | 1770 | 480.5 |
| C | 1 | 80 | 5679 | 8.14 | 1894 | 1770 | 480.5 |
| C | 3 | 202 | 5623 | 8.02 | 1894 | 1770 | 480.5 |
| D | 4 | 160 | 4514 | 6.25 | 1755 | 1593 | 467.0 |
| D | 7 | 3 | 4467 | 6.15 | 1755 | 1593 | 467.0 |
| D | 10 | 189 | 4455 | 6.13 | 1755 | 1593 | 467.0 |
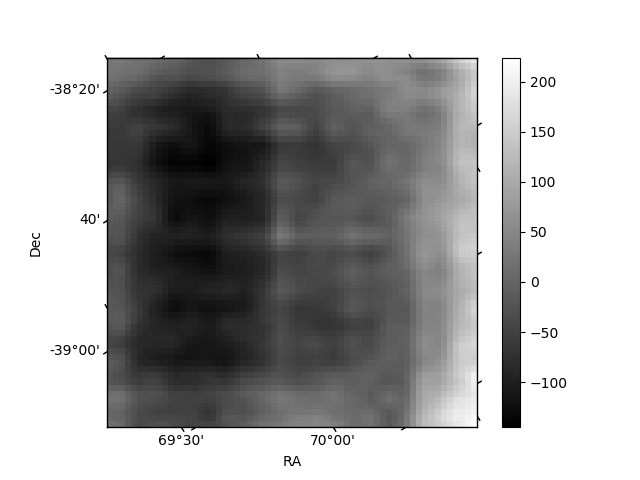
Histogram calculated using DETX and DETY for each event in the final _common_clean file
| Quadrant A |  |
 |
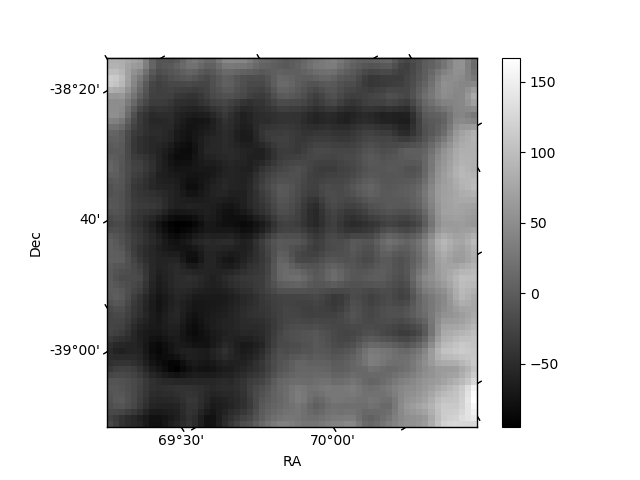
Quadrant B |
|---|---|---|---|
| Quadrant D |  |
 |
Quadrant C |
| Plot type | Count rate plots | Images |
|---|---|---|
| Comparison with Poisson distribution Blue bars denote a histogram of data divided into 1 sec bins. Red curve is a Poisson curve with rate = median count rate of data. |
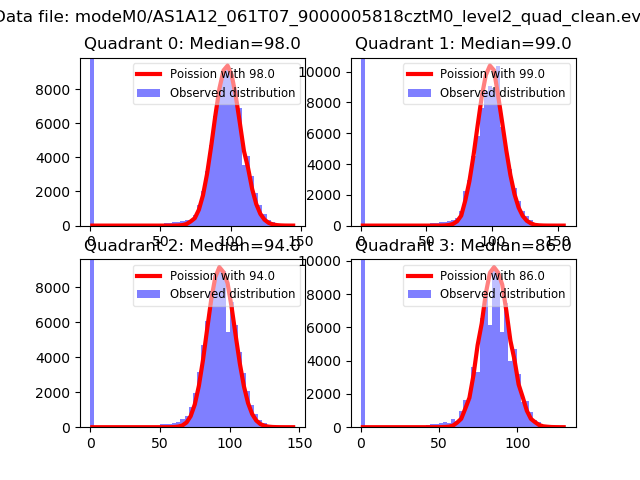 |
 |
| Quadrant-wise count rates Data is divided into 100 sec bins |
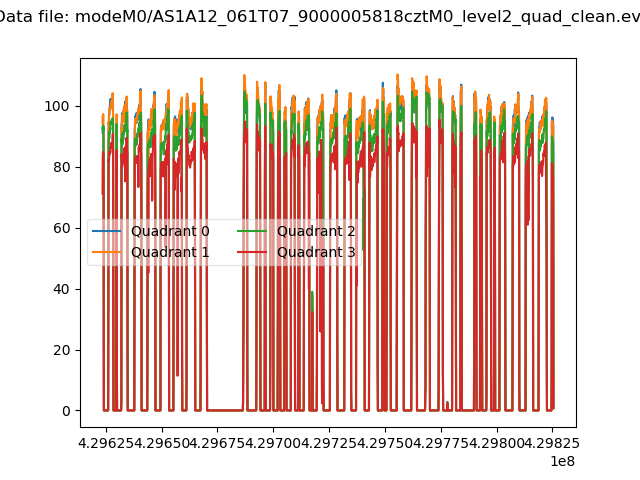 |
|
| Module-wise count rates for Quadrant A Data is divided into 100 sec bins |
 |
 |
| Module-wise count rates for Quadrant B Data is divided into 100 sec bins |
 |
 |
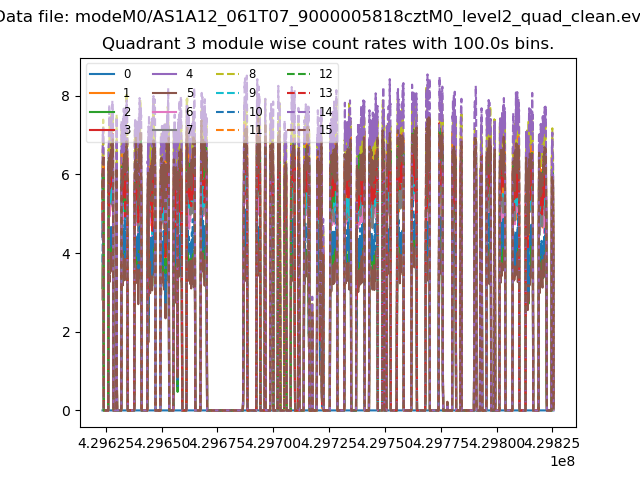
| Module-wise count rates for Quadrant C Data is divided into 100 sec bins |
 |
 |
| Module-wise count rates for Quadrant D Data is divided into 100 sec bins |
 |
 |
| Parameter | Plot |
|---|---|
| CZT HV Monitor |  |
| D_VDD | 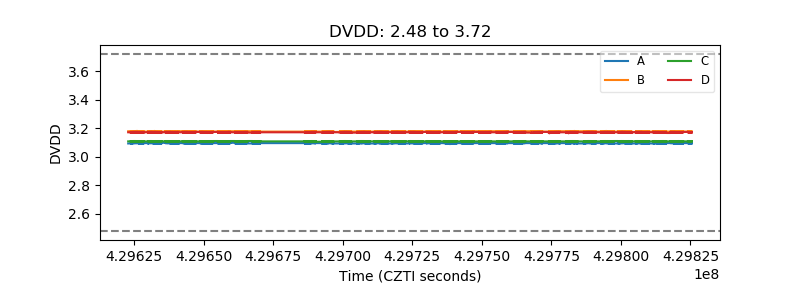 |
| Temperature 1 |  |
| Veto HV Monitor |  |
| Veto LLD | 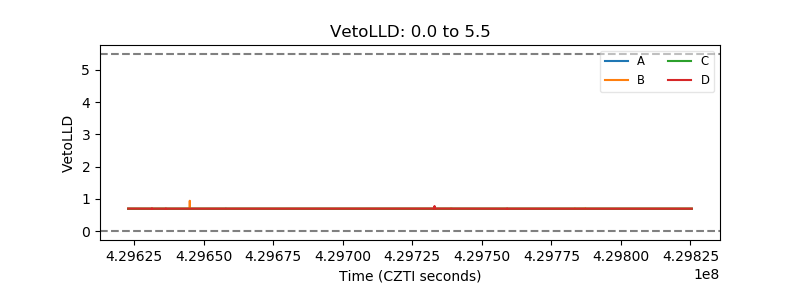 |
| Alpha Counter |  |
| _CPM_Rate | 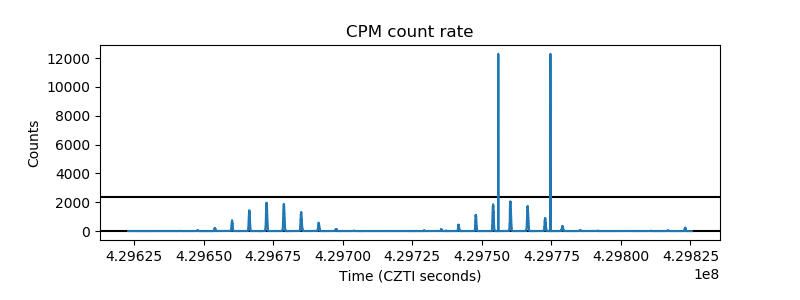 |
| CZT Counter |  |
| +2.5 Volts monitor |  |
| +5 Volts monitor | 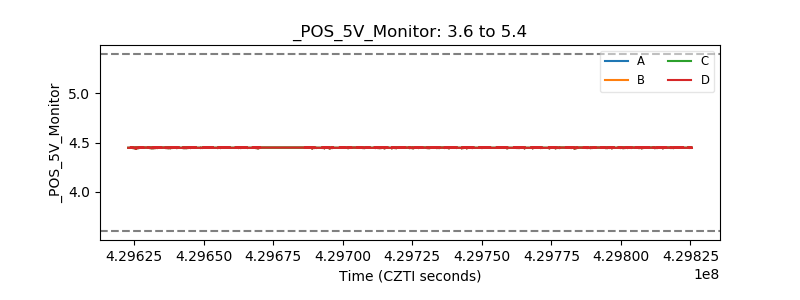 |
| _ROLL_ROT |  |
| _Roll_DEC |  |
| _Roll_RA | 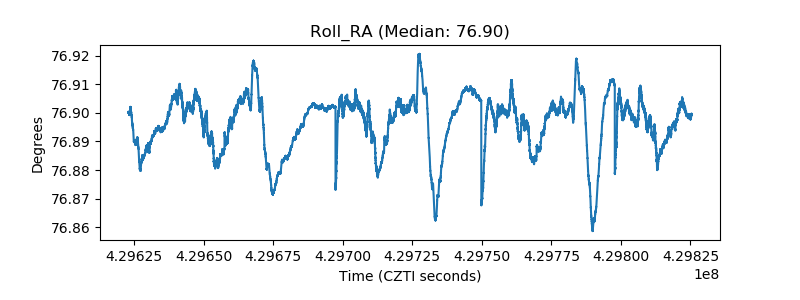 |
| Veto Counter |  |