| Param | Original file | Final file |
|---|---|---|
| Filename | modeM0/AS1C06_010T01_9000005800cztM0_level2.fits | modeM0/AS1C06_010T01_9000005800cztM0_level2_quad_clean.evt |
| Size (bytes) | 1,111,152,960 | 1,748,220,480 |
| Size | 1.0 GB | 1.6 GB |
| Events in quadrant A | 6,657,720 | 11,652,015 |
| Events in quadrant B | 6,268,340 | 11,396,989 |
| Events in quadrant C | 6,463,918 | 11,109,276 |
| Events in quadrant D | 5,566,384 | 10,104,405 |
| Mode M9 | |||
|---|---|---|---|
| Quadrant | BADHDUFLAG | Total packets | Discarded packets |
| A | 0 | 472 | 0 |
| B | 0 | 474 | 0 |
| C | 0 | 474 | 0 |
| D | 0 | 474 | 0 |
| Mode M0 | |||
|---|---|---|---|
| Quadrant | BADHDUFLAG | Total packets | Discarded packets |
| A | 0 | 276193 | 0 |
| B | 0 | 277275 | 0 |
| C | 0 | 277036 | 0 |
| D | 0 | 338343 | 0 |
| Mode SS | |||
|---|---|---|---|
| Quadrant | BADHDUFLAG | Total packets | Discarded packets |
| A | 0 | 2590 | 0 |
| B | 0 | 2590 | 0 |
| C | 0 | 2590 | 0 |
| D | 0 | 2590 | 0 |
| Quadrant | Total seconds | Saturated seconds | Saturation percentage |
|---|---|---|---|
| A | 126855 | 390 | 0.307438% |
| B | 126855 | 1543 | 1.216349% |
| C | 126855 | 1391 | 1.096528% |
| D | 126854 | 5631 | 4.438961% |
Noise dominated data is calculated using 1-second bins in cleaned event files. If a bin has >2000 counts, and if more than 50% of those come from <1% of pixels, then it is considered to be noise-dominated and hence unusable.
| Quadrant | # 1 sec bins | Bins with >0 counts | Bins with >2000 counts | High rate bins dominated by noise | Noise dominated (total time) | Noise dominated (detector-on time) | Marked lightcurve |
|---|---|---|---|---|---|---|---|
| A | 192495 | 126854 | 0 | 0 | 0.00% | 0.00% |  |
| B | 192495 | 126840 | 0 | 0 | 0.00% | 0.00% |  |
| C | 192495 | 126835 | 0 | 0 | 0.00% | 0.00% | 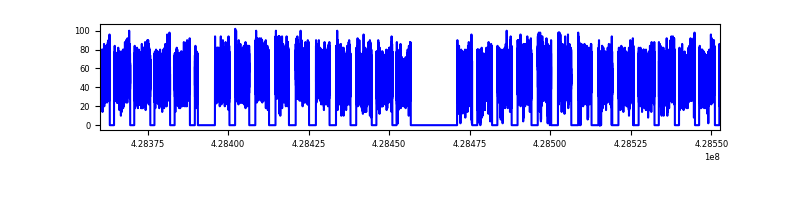 |
| D | 192495 | 126763 | 0 | 0 | 0.00% | 0.00% |  |
Top three noisy pixels from each quadrant. If the there are fewer than three noisy pixels in the level2.evt file, extra rows are filled as -1
| Pixel properties | Quadrant properties | ||||||
|---|---|---|---|---|---|---|---|
| Quadrant | DetID | PixID | Counts | Sigma | Mean | Median | Sigma |
| A | 9 | 19 | 5626 | 9.25 | 1738 | 1636 | 431.4 |
| A | 7 | 110 | 5610 | 9.21 | 1738 | 1636 | 431.4 |
| A | 0 | 29 | 5489 | 8.93 | 1738 | 1636 | 431.4 |
| B | 2 | 9 | 5339 | 11.86 | 1663 | 1591 | 315.9 |
| B | 3 | 80 | 4562 | 9.4 | 1663 | 1591 | 315.9 |
| B | 2 | 8 | 4343 | 8.71 | 1663 | 1591 | 315.9 |
| C | 1 | 81 | 5454 | 8.88 | 1709 | 1603 | 433.8 |
| C | 1 | 80 | 5251 | 8.41 | 1709 | 1603 | 433.8 |
| C | 3 | 203 | 5225 | 8.35 | 1709 | 1603 | 433.8 |
| D | 7 | 3 | 4327 | 6.73 | 1599 | 1459 | 426.4 |
| D | 4 | 160 | 4271 | 6.6 | 1599 | 1459 | 426.4 |
| D | 10 | 189 | 4178 | 6.38 | 1599 | 1459 | 426.4 |
Histogram calculated using DETX and DETY for each event in the final _common_clean file
| Quadrant A |  |
 |
Quadrant B |
|---|---|---|---|
| Quadrant D |  |
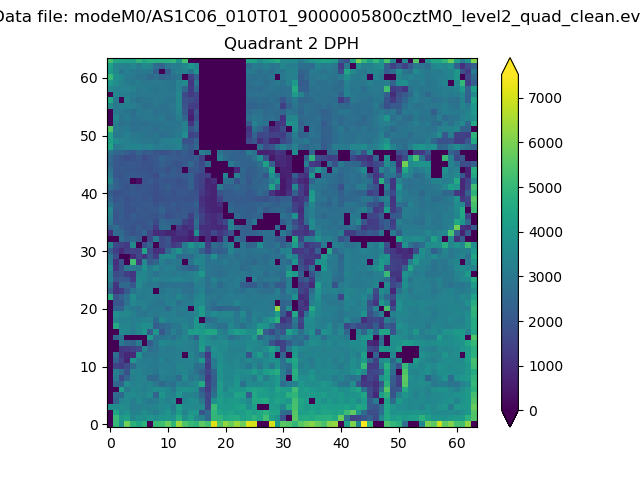 |
Quadrant C |
| Plot type | Count rate plots | Images |
|---|---|---|
| Comparison with Poisson distribution Blue bars denote a histogram of data divided into 1 sec bins. Red curve is a Poisson curve with rate = median count rate of data. |
 |
 |
| Quadrant-wise count rates Data is divided into 100 sec bins |
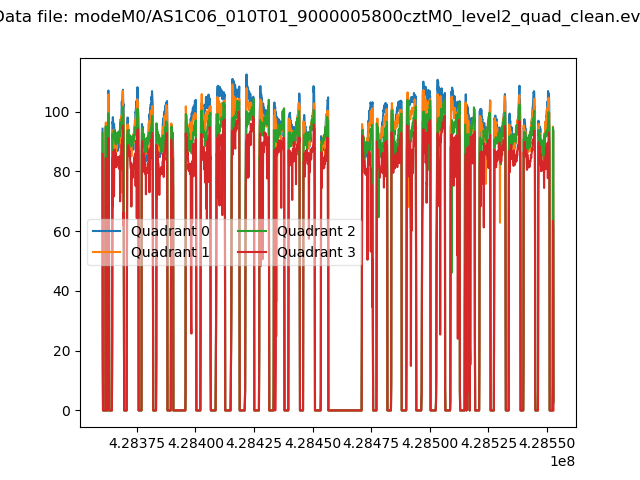 |
|
| Module-wise count rates for Quadrant A Data is divided into 100 sec bins |
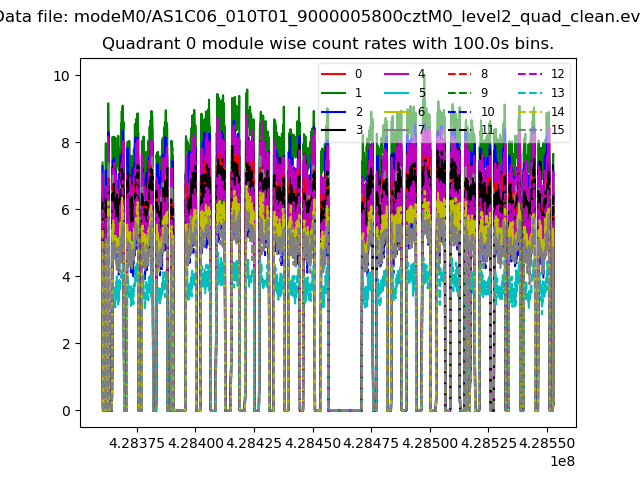 |
 |
| Module-wise count rates for Quadrant B Data is divided into 100 sec bins |
 |
 |
| Module-wise count rates for Quadrant C Data is divided into 100 sec bins |
 |
 |
| Module-wise count rates for Quadrant D Data is divided into 100 sec bins |
 |
 |
| Parameter | Plot |
|---|---|
| CZT HV Monitor |  |
| D_VDD |  |
| Temperature 1 |  |
| Veto HV Monitor |  |
| Veto LLD | 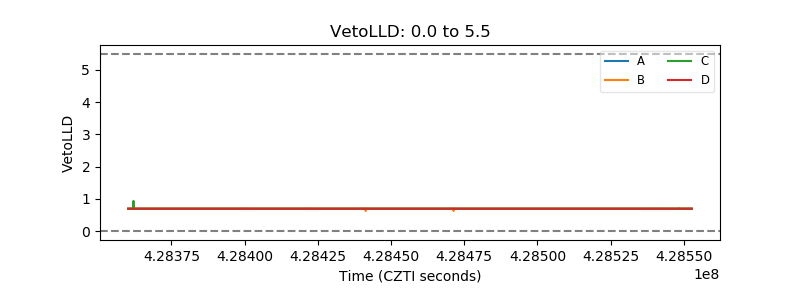 |
| Alpha Counter | 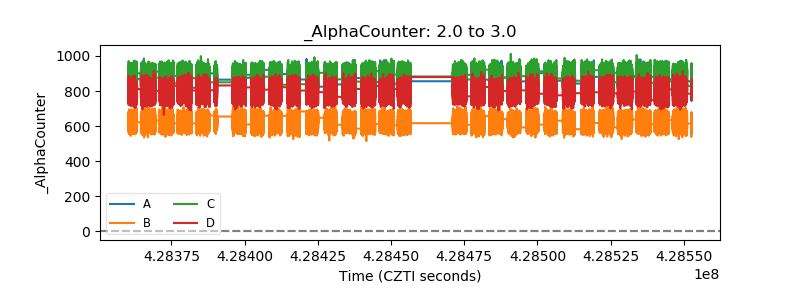 |
| _CPM_Rate |  |
| CZT Counter | 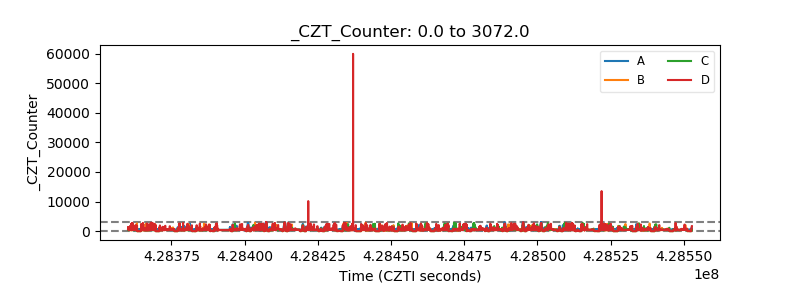 |
| +2.5 Volts monitor |  |
| +5 Volts monitor |  |
| _ROLL_ROT |  |
| _Roll_DEC |  |
| _Roll_RA | 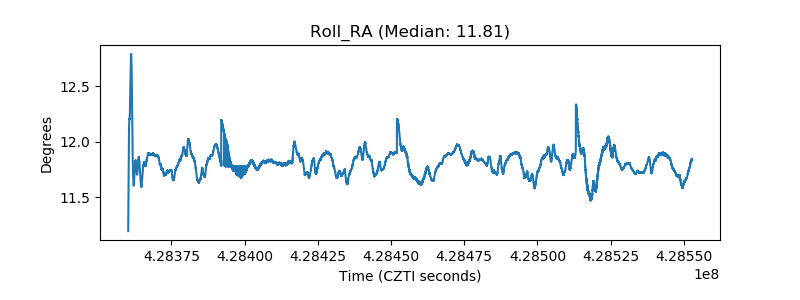 |
| Veto Counter | 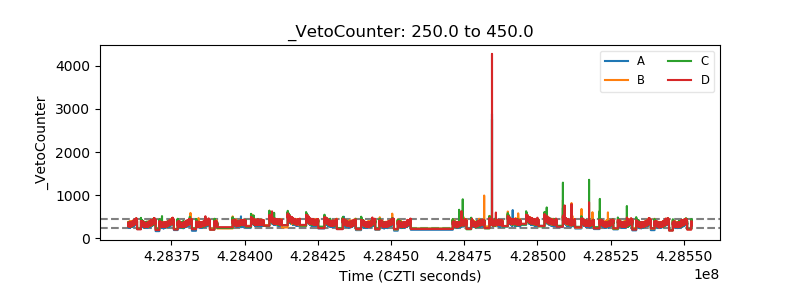 |