| Param | Original file | Final file |
|---|---|---|
| Filename | modeM0/AS1A12_102T01_9000005794cztM0_level2.fits | modeM0/AS1A12_102T01_9000005794cztM0_level2_quad_clean.evt |
| Size (bytes) | 310,668,480 | 403,727,040 |
| Size | 296.3 MB | 385.0 MB |
| Events in quadrant A | 1,871,524 | 2,597,005 |
| Events in quadrant B | 1,785,288 | 2,563,693 |
| Events in quadrant C | 1,840,756 | 2,476,181 |
| Events in quadrant D | 1,582,190 | 2,262,030 |
| Mode M9 | |||
|---|---|---|---|
| Quadrant | BADHDUFLAG | Total packets | Discarded packets |
| A | 0 | 158 | 0 |
| B | 0 | 158 | 0 |
| C | 0 | 159 | 0 |
| D | 0 | 159 | 0 |
| Mode SS | |||
|---|---|---|---|
| Quadrant | BADHDUFLAG | Total packets | Discarded packets |
| A | 0 | 698 | 0 |
| B | 0 | 698 | 0 |
| C | 0 | 698 | 0 |
| D | 0 | 698 | 0 |
| Mode M0 | |||
|---|---|---|---|
| Quadrant | BADHDUFLAG | Total packets | Discarded packets |
| A | 0 | 75468 | 0 |
| B | 0 | 70844 | 0 |
| C | 0 | 68702 | 0 |
| D | 0 | 82814 | 0 |
| Quadrant | Total seconds | Saturated seconds | Saturation percentage |
|---|---|---|---|
| A | 33885 | 135 | 0.398406% |
| B | 33885 | 185 | 0.545964% |
| C | 33885 | 32 | 0.094437% |
| D | 33885 | 938 | 2.768187% |
Noise dominated data is calculated using 1-second bins in cleaned event files. If a bin has >2000 counts, and if more than 50% of those come from <1% of pixels, then it is considered to be noise-dominated and hence unusable.
| Quadrant | # 1 sec bins | Bins with >0 counts | Bins with >2000 counts | High rate bins dominated by noise | Noise dominated (total time) | Noise dominated (detector-on time) | Marked lightcurve |
|---|---|---|---|---|---|---|---|
| A | 73047 | 33884 | 0 | 0 | 0.00% | 0.00% |  |
| B | 73047 | 33885 | 0 | 0 | 0.00% | 0.00% |  |
| C | 73047 | 33885 | 0 | 0 | 0.00% | 0.00% |  |
| D | 73047 | 33873 | 0 | 0 | 0.00% | 0.00% | 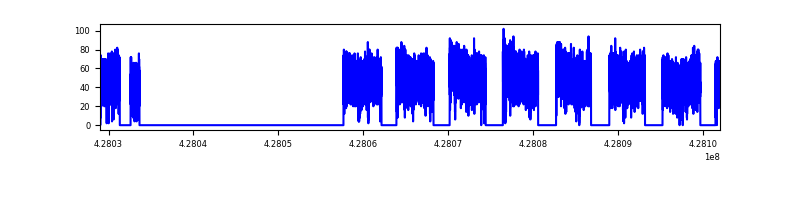 |
Top three noisy pixels from each quadrant. If the there are fewer than three noisy pixels in the level2.evt file, extra rows are filled as -1
| Pixel properties | Quadrant properties | ||||||
|---|---|---|---|---|---|---|---|
| Quadrant | DetID | PixID | Counts | Sigma | Mean | Median | Sigma |
| A | 9 | 19 | 1596 | 9.21 | 488 | 460 | 123.4 |
| A | 7 | 110 | 1560 | 8.92 | 488 | 460 | 123.4 |
| A | 0 | 29 | 1481 | 8.28 | 488 | 460 | 123.4 |
| B | 2 | 9 | 1505 | 11.55 | 472 | 452 | 91.2 |
| B | 3 | 80 | 1287 | 9.16 | 472 | 452 | 91.2 |
| B | 3 | 17 | 1259 | 8.85 | 472 | 452 | 91.2 |
| C | 3 | 203 | 1516 | 8.51 | 486 | 458 | 124.3 |
| C | 3 | 202 | 1514 | 8.5 | 486 | 458 | 124.3 |
| C | 1 | 81 | 1489 | 8.3 | 486 | 458 | 124.3 |
| D | 7 | 3 | 1242 | 6.8 | 452 | 413 | 121.9 |
| D | 10 | 189 | 1227 | 6.68 | 452 | 413 | 121.9 |
| D | 10 | 113 | 1182 | 6.31 | 452 | 413 | 121.9 |
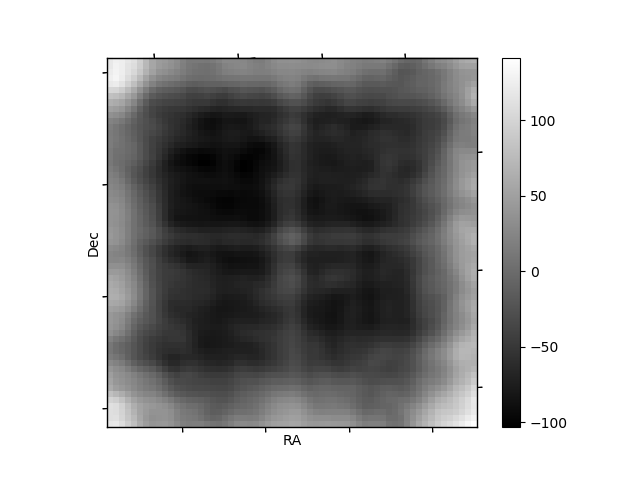
Histogram calculated using DETX and DETY for each event in the final _common_clean file
| Quadrant A | 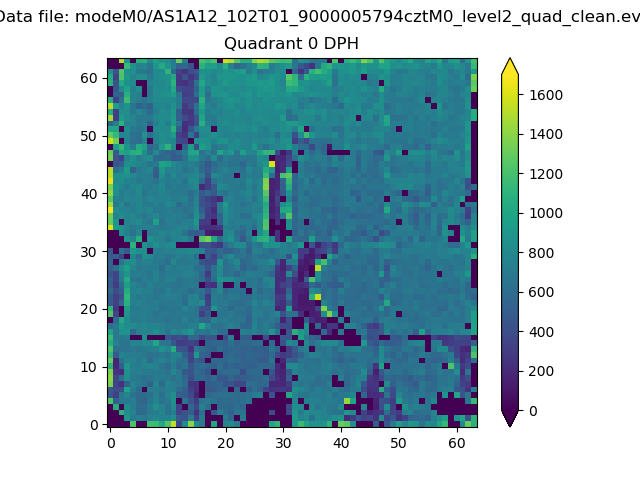 |
 |
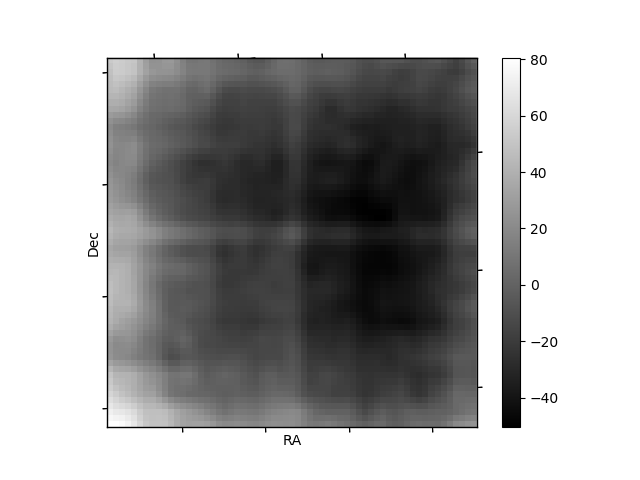
Quadrant B |
|---|---|---|---|
| Quadrant D |  |
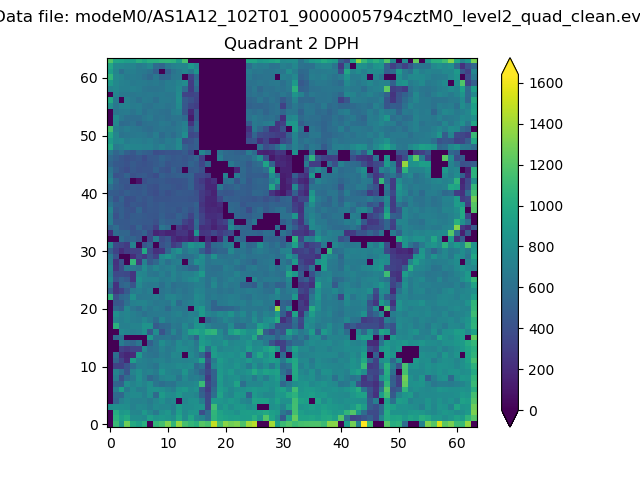 |
Quadrant C |
| Plot type | Count rate plots | Images |
|---|---|---|
| Comparison with Poisson distribution Blue bars denote a histogram of data divided into 1 sec bins. Red curve is a Poisson curve with rate = median count rate of data. |
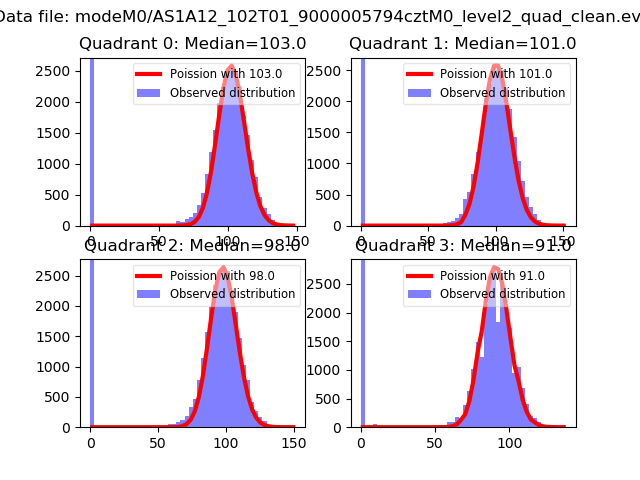 |
 |
| Quadrant-wise count rates Data is divided into 100 sec bins |
 |
|
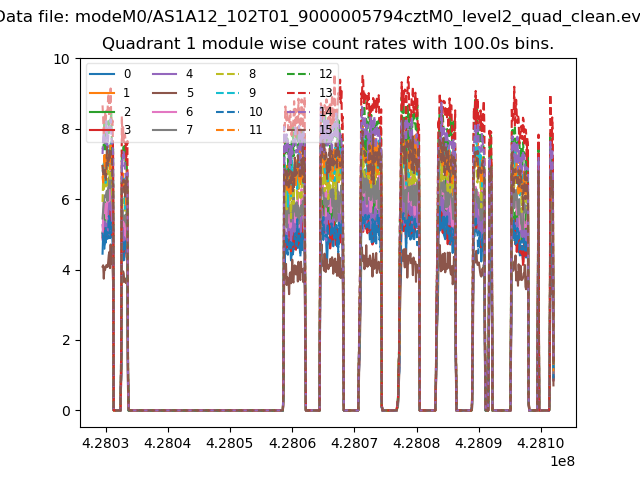
| Module-wise count rates for Quadrant A Data is divided into 100 sec bins |
 |
 |
| Module-wise count rates for Quadrant B Data is divided into 100 sec bins |
 |
 |
| Module-wise count rates for Quadrant C Data is divided into 100 sec bins |
 |
 |
| Module-wise count rates for Quadrant D Data is divided into 100 sec bins |
 |
 |
| Parameter | Plot |
|---|---|
| CZT HV Monitor |  |
| D_VDD |  |
| Temperature 1 |  |
| Veto HV Monitor | 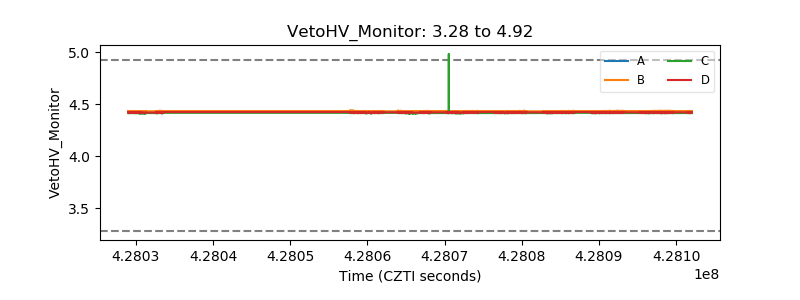 |
| Veto LLD |  |
| Alpha Counter | 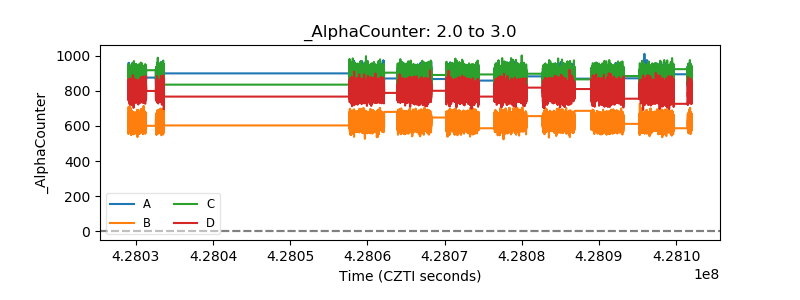 |
| _CPM_Rate |  |
| CZT Counter |  |
| +2.5 Volts monitor | 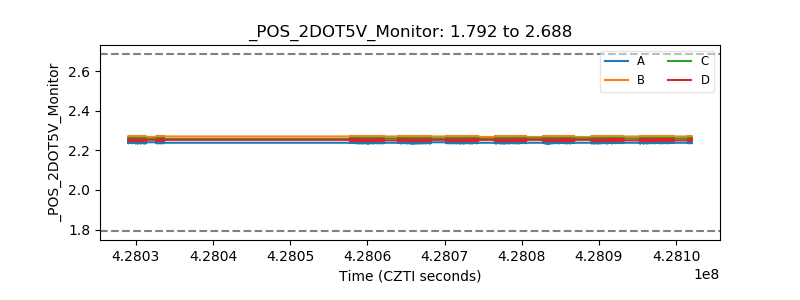 |
| +5 Volts monitor |  |
| _ROLL_ROT |  |
| _Roll_DEC |  |
| _Roll_RA |  |
| Veto Counter |  |