| Param | Original file | Final file |
|---|---|---|
| Filename | modeM0/AS1A12_089T08_9000005790cztM0_level2.fits | modeM0/AS1A12_089T08_9000005790cztM0_level2_quad_clean.evt |
| Size (bytes) | 230,857,920 | 267,007,680 |
| Size | 220.2 MB | 254.6 MB |
| Events in quadrant A | 1,388,088 | 1,649,899 |
| Events in quadrant B | 1,335,722 | 1,662,115 |
| Events in quadrant C | 1,363,742 | 1,606,966 |
| Events in quadrant D | 1,166,216 | 1,429,467 |
| Mode M0 | |||
|---|---|---|---|
| Quadrant | BADHDUFLAG | Total packets | Discarded packets |
| A | 0 | 56378 | 0 |
| B | 0 | 52960 | 0 |
| C | 0 | 51483 | 0 |
| D | 0 | 65722 | 0 |
| Mode SS | |||
|---|---|---|---|
| Quadrant | BADHDUFLAG | Total packets | Discarded packets |
| A | 0 | 516 | 0 |
| B | 0 | 518 | 0 |
| C | 0 | 518 | 0 |
| D | 0 | 518 | 0 |
| Mode M9 | |||
|---|---|---|---|
| Quadrant | BADHDUFLAG | Total packets | Discarded packets |
| A | 0 | 109 | 0 |
| B | 0 | 110 | 0 |
| C | 0 | 110 | 0 |
| D | 0 | 110 | 0 |
| Quadrant | Total seconds | Saturated seconds | Saturation percentage |
|---|---|---|---|
| A | 25263 | 106 | 0.419586% |
| B | 25262 | 85 | 0.336474% |
| C | 25259 | 26 | 0.102934% |
| D | 25264 | 827 | 3.273433% |
Noise dominated data is calculated using 1-second bins in cleaned event files. If a bin has >2000 counts, and if more than 50% of those come from <1% of pixels, then it is considered to be noise-dominated and hence unusable.
| Quadrant | # 1 sec bins | Bins with >0 counts | Bins with >2000 counts | High rate bins dominated by noise | Noise dominated (total time) | Noise dominated (detector-on time) | Marked lightcurve |
|---|---|---|---|---|---|---|---|
| A | 82301 | 25265 | 0 | 0 | 0.00% | 0.00% |  |
| B | 82301 | 25264 | 0 | 0 | 0.00% | 0.00% |  |
| C | 82301 | 25263 | 0 | 0 | 0.00% | 0.00% | 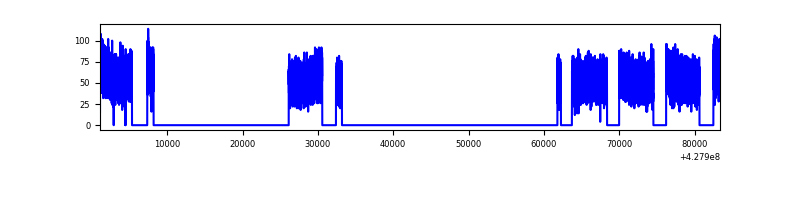 |
| D | 82301 | 25254 | 0 | 0 | 0.00% | 0.00% |  |
Top three noisy pixels from each quadrant. If the there are fewer than three noisy pixels in the level2.evt file, extra rows are filled as -1
| Pixel properties | Quadrant properties | ||||||
|---|---|---|---|---|---|---|---|
| Quadrant | DetID | PixID | Counts | Sigma | Mean | Median | Sigma |
| A | 9 | 19 | 1144 | 8.77 | 363 | 341 | 91.6 |
| A | 0 | 29 | 1117 | 8.47 | 363 | 341 | 91.6 |
| A | 7 | 110 | 1112 | 8.42 | 363 | 341 | 91.6 |
| B | 2 | 9 | 1183 | 11.93 | 353 | 338 | 70.8 |
| B | 2 | 8 | 976 | 9.01 | 353 | 338 | 70.8 |
| B | 3 | 80 | 975 | 9.0 | 353 | 338 | 70.8 |
| C | 1 | 81 | 1130 | 8.38 | 360 | 337 | 94.6 |
| C | 3 | 202 | 1076 | 7.81 | 360 | 337 | 94.6 |
| C | 3 | 203 | 1058 | 7.62 | 360 | 337 | 94.6 |
| D | 4 | 160 | 889 | 6.53 | 334 | 304 | 89.6 |
| D | 6 | 62 | 866 | 6.27 | 334 | 304 | 89.6 |
| D | 7 | 3 | 865 | 6.26 | 334 | 304 | 89.6 |
Histogram calculated using DETX and DETY for each event in the final _common_clean file
| Quadrant A |  |
 |
Quadrant B |
|---|---|---|---|
| Quadrant D | 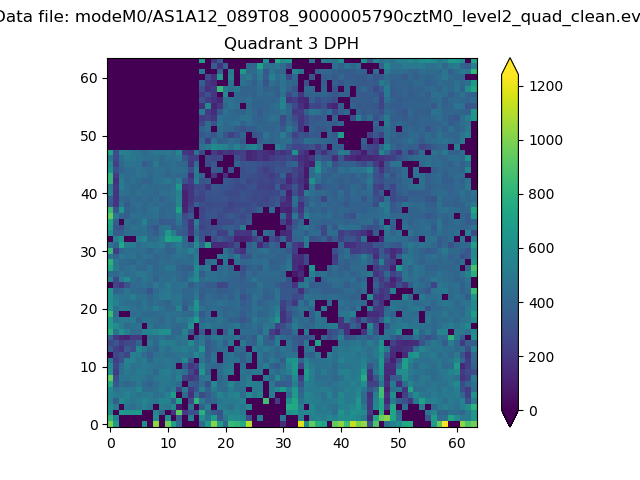 |
 |
Quadrant C |
| Plot type | Count rate plots | Images |
|---|---|---|
| Comparison with Poisson distribution Blue bars denote a histogram of data divided into 1 sec bins. Red curve is a Poisson curve with rate = median count rate of data. |
 |
 |
| Quadrant-wise count rates Data is divided into 100 sec bins |
 |
|
| Module-wise count rates for Quadrant A Data is divided into 100 sec bins |
 |
 |
| Module-wise count rates for Quadrant B Data is divided into 100 sec bins |
 |
 |
| Module-wise count rates for Quadrant C Data is divided into 100 sec bins |
 |
 |
| Module-wise count rates for Quadrant D Data is divided into 100 sec bins |
 |
 |
| Parameter | Plot |
|---|---|
| CZT HV Monitor |  |
| D_VDD |  |
| Temperature 1 |  |
| Veto HV Monitor |  |
| Veto LLD |  |
| Alpha Counter |  |
| _CPM_Rate |  |
| CZT Counter |  |
| +2.5 Volts monitor |  |
| +5 Volts monitor |  |
| _ROLL_ROT |  |
| _Roll_DEC | 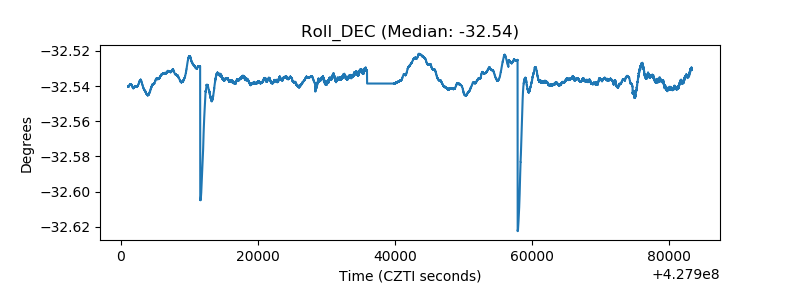 |
| _Roll_RA |  |
| Veto Counter |  |