| Param | Original file | Final file |
|---|---|---|
| Filename | modeM0/AS1A12_088T52_9000005778cztM0_level2.fits | modeM0/AS1A12_088T52_9000005778cztM0_level2_quad_clean.evt |
| Size (bytes) | 157,176,000 | 198,293,760 |
| Size | 149.9 MB | 189.1 MB |
| Events in quadrant A | 946,014 | 1,269,420 |
| Events in quadrant B | 895,974 | 1,243,441 |
| Events in quadrant C | 926,308 | 1,230,421 |
| Events in quadrant D | 777,742 | 1,048,196 |
| Mode SS | |||
|---|---|---|---|
| Quadrant | BADHDUFLAG | Total packets | Discarded packets |
| A | 0 | 360 | 0 |
| B | 0 | 360 | 0 |
| C | 0 | 360 | 0 |
| D | 0 | 360 | 0 |
| Mode M9 | |||
|---|---|---|---|
| Quadrant | BADHDUFLAG | Total packets | Discarded packets |
| A | 0 | 66 | 0 |
| B | 0 | 66 | 0 |
| C | 0 | 66 | 0 |
| D | 0 | 66 | 0 |
| Mode M0 | |||
|---|---|---|---|
| Quadrant | BADHDUFLAG | Total packets | Discarded packets |
| A | 0 | 41316 | 0 |
| B | 0 | 39722 | 0 |
| C | 0 | 35625 | 0 |
| D | 0 | 55400 | 0 |
| Quadrant | Total seconds | Saturated seconds | Saturation percentage |
|---|---|---|---|
| A | 17607 | 106 | 0.602033% |
| B | 17607 | 488 | 2.771625% |
| C | 17607 | 17 | 0.096553% |
| D | 17607 | 1125 | 6.389504% |
Noise dominated data is calculated using 1-second bins in cleaned event files. If a bin has >2000 counts, and if more than 50% of those come from <1% of pixels, then it is considered to be noise-dominated and hence unusable.
| Quadrant | # 1 sec bins | Bins with >0 counts | Bins with >2000 counts | High rate bins dominated by noise | Noise dominated (total time) | Noise dominated (detector-on time) | Marked lightcurve |
|---|---|---|---|---|---|---|---|
| A | 24209 | 17607 | 0 | 0 | 0.00% | 0.00% |  |
| B | 24209 | 17605 | 0 | 0 | 0.00% | 0.00% |  |
| C | 24209 | 17607 | 0 | 0 | 0.00% | 0.00% |  |
| D | 24209 | 17599 | 0 | 0 | 0.00% | 0.00% | 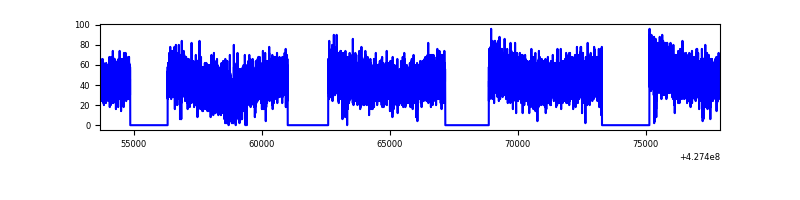 |
Top three noisy pixels from each quadrant. If the there are fewer than three noisy pixels in the level2.evt file, extra rows are filled as -1
| Pixel properties | Quadrant properties | ||||||
|---|---|---|---|---|---|---|---|
| Quadrant | DetID | PixID | Counts | Sigma | Mean | Median | Sigma |
| A | 9 | 19 | 782 | 8.67 | 246 | 231 | 63.6 |
| A | 0 | 29 | 777 | 8.59 | 246 | 231 | 63.6 |
| A | 7 | 110 | 737 | 7.96 | 246 | 231 | 63.6 |
| B | 2 | 9 | 754 | 11.16 | 236 | 225 | 47.4 |
| B | 2 | 8 | 639 | 8.73 | 236 | 225 | 47.4 |
| B | 3 | 17 | 612 | 8.16 | 236 | 225 | 47.4 |
| C | 1 | 81 | 798 | 8.75 | 244 | 229 | 65.0 |
| C | 3 | 203 | 763 | 8.21 | 244 | 229 | 65.0 |
| C | 3 | 202 | 755 | 8.09 | 244 | 229 | 65.0 |
| D | 7 | 3 | 609 | 6.68 | 222 | 202 | 61.0 |
| D | 4 | 160 | 588 | 6.33 | 222 | 202 | 61.0 |
| D | 10 | 189 | 587 | 6.31 | 222 | 202 | 61.0 |
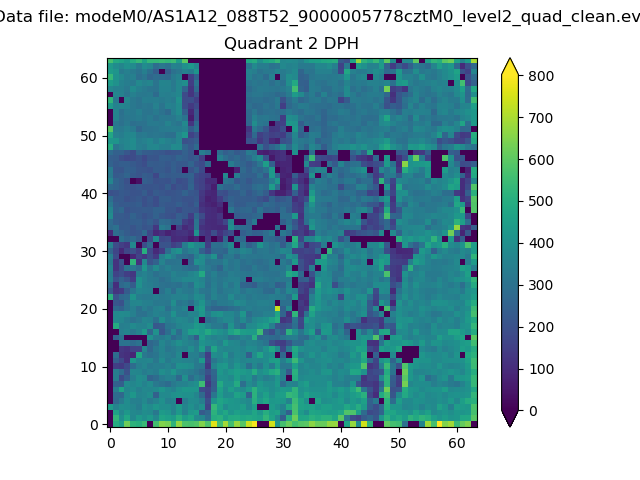
Histogram calculated using DETX and DETY for each event in the final _common_clean file
| Quadrant A |  |
 |
Quadrant B |
|---|---|---|---|
| Quadrant D | 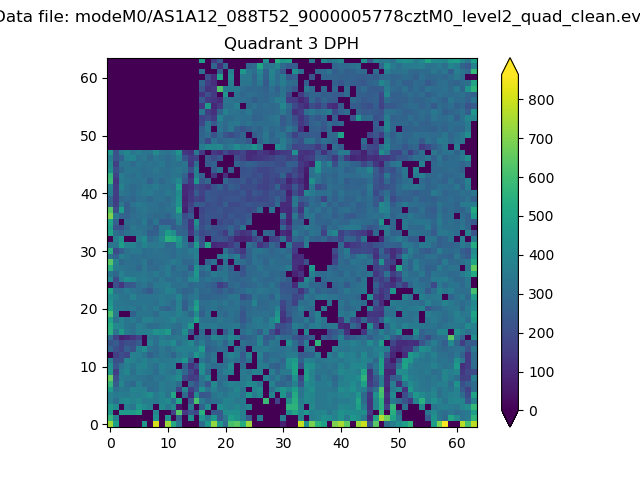 |
 |
Quadrant C |
| Plot type | Count rate plots | Images |
|---|---|---|
| Comparison with Poisson distribution Blue bars denote a histogram of data divided into 1 sec bins. Red curve is a Poisson curve with rate = median count rate of data. |
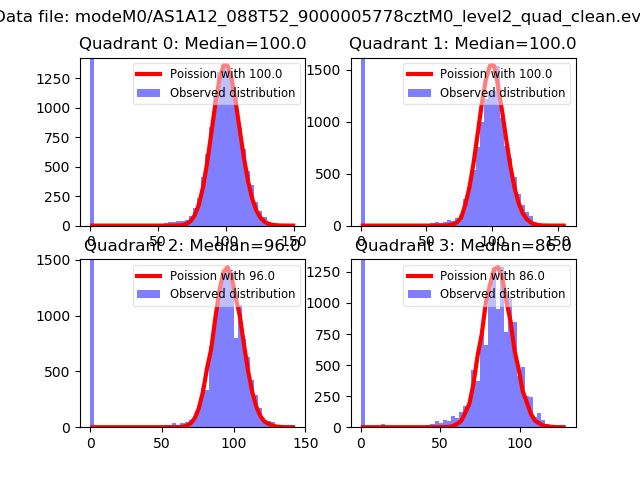 |
 |
| Quadrant-wise count rates Data is divided into 100 sec bins |
 |
|
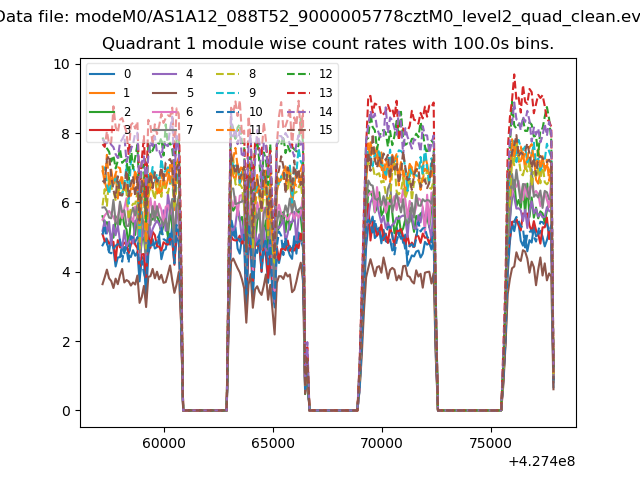
| Module-wise count rates for Quadrant A Data is divided into 100 sec bins |
 |
 |
| Module-wise count rates for Quadrant B Data is divided into 100 sec bins |
 |
 |
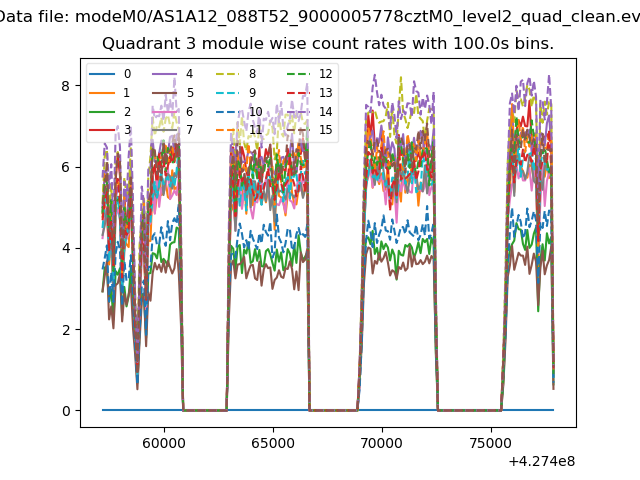
| Module-wise count rates for Quadrant C Data is divided into 100 sec bins |
 |
 |
| Module-wise count rates for Quadrant D Data is divided into 100 sec bins |
 |
 |
| Parameter | Plot |
|---|---|
| CZT HV Monitor | 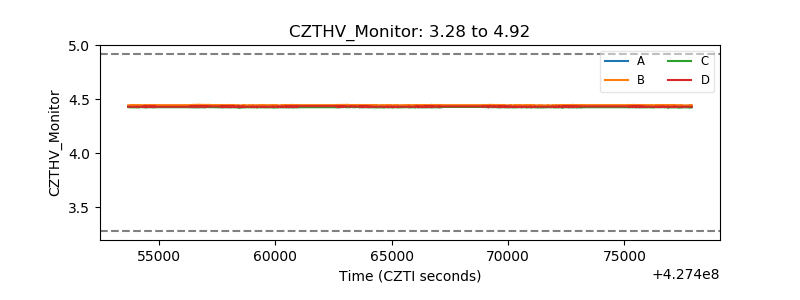 |
| D_VDD |  |
| Temperature 1 |  |
| Veto HV Monitor | 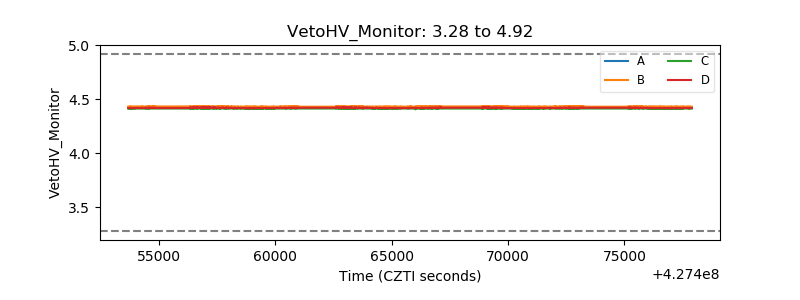 |
| Veto LLD | 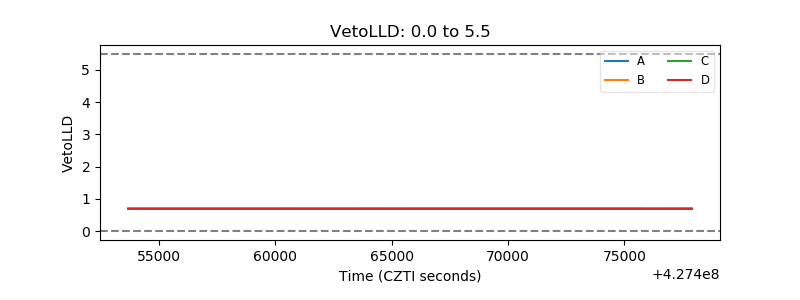 |
| Alpha Counter |  |
| _CPM_Rate |  |
| CZT Counter |  |
| +2.5 Volts monitor |  |
| +5 Volts monitor |  |
| _ROLL_ROT |  |
| _Roll_DEC |  |
| _Roll_RA |  |
| Veto Counter |  |