| Param | Original file | Final file |
|---|---|---|
| Filename | modeM0/AS1A12_088T51_9000005780cztM0_level2.fits | modeM0/AS1A12_088T51_9000005780cztM0_level2_quad_clean.evt |
| Size (bytes) | 301,170,240 | 271,912,320 |
| Size | 287.2 MB | 259.3 MB |
| Events in quadrant A | 1,797,590 | 1,541,545 |
| Events in quadrant B | 1,738,860 | 1,550,791 |
| Events in quadrant C | 1,771,328 | 1,490,451 |
| Events in quadrant D | 1,517,122 | 1,355,340 |
| Mode M9 | |||
|---|---|---|---|
| Quadrant | BADHDUFLAG | Total packets | Discarded packets |
| A | 0 | 146 | 0 |
| B | 0 | 146 | 0 |
| C | 0 | 146 | 0 |
| D | 0 | 146 | 0 |
| Mode M0 | |||
|---|---|---|---|
| Quadrant | BADHDUFLAG | Total packets | Discarded packets |
| A | 0 | 77091 | 0 |
| B | 0 | 71520 | 0 |
| C | 0 | 67551 | 0 |
| D | 0 | 82913 | 0 |
| Mode SS | |||
|---|---|---|---|
| Quadrant | BADHDUFLAG | Total packets | Discarded packets |
| A | 0 | 684 | 0 |
| B | 0 | 684 | 0 |
| C | 0 | 684 | 0 |
| D | 0 | 684 | 0 |
| Quadrant | Total seconds | Saturated seconds | Saturation percentage |
|---|---|---|---|
| A | 33418 | 423 | 1.265785% |
| B | 33418 | 321 | 0.960560% |
| C | 33418 | 28 | 0.083787% |
| D | 33418 | 851 | 2.546532% |
Noise dominated data is calculated using 1-second bins in cleaned event files. If a bin has >2000 counts, and if more than 50% of those come from <1% of pixels, then it is considered to be noise-dominated and hence unusable.
| Quadrant | # 1 sec bins | Bins with >0 counts | Bins with >2000 counts | High rate bins dominated by noise | Noise dominated (total time) | Noise dominated (detector-on time) | Marked lightcurve |
|---|---|---|---|---|---|---|---|
| A | 47973 | 33417 | 0 | 0 | 0.00% | 0.00% |  |
| B | 47973 | 33414 | 0 | 0 | 0.00% | 0.00% |  |
| C | 47973 | 33418 | 0 | 0 | 0.00% | 0.00% | 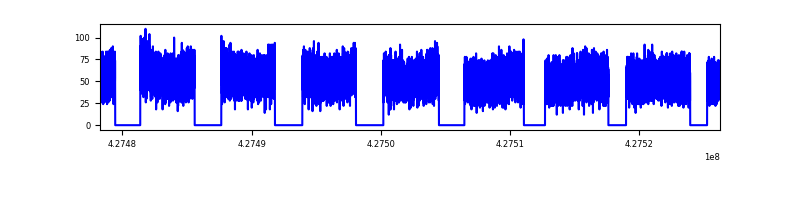 |
| D | 47973 | 33405 | 0 | 0 | 0.00% | 0.00% |  |
Top three noisy pixels from each quadrant. If the there are fewer than three noisy pixels in the level2.evt file, extra rows are filled as -1
| Pixel properties | Quadrant properties | ||||||
|---|---|---|---|---|---|---|---|
| Quadrant | DetID | PixID | Counts | Sigma | Mean | Median | Sigma |
| A | 9 | 19 | 1540 | 9.15 | 469 | 440 | 120.2 |
| A | 0 | 29 | 1493 | 8.76 | 469 | 440 | 120.2 |
| A | 7 | 110 | 1479 | 8.64 | 469 | 440 | 120.2 |
| B | 2 | 9 | 1556 | 12.33 | 460 | 439 | 90.6 |
| B | 3 | 80 | 1263 | 9.1 | 460 | 439 | 90.6 |
| B | 3 | 17 | 1227 | 8.7 | 460 | 439 | 90.6 |
| C | 1 | 81 | 1428 | 8.14 | 468 | 438 | 121.6 |
| C | 1 | 80 | 1342 | 7.44 | 468 | 438 | 121.6 |
| C | 1 | 65 | 1240 | 6.6 | 468 | 438 | 121.6 |
| D | 7 | 3 | 1153 | 6.45 | 434 | 395 | 117.6 |
| D | 6 | 38 | 1139 | 6.33 | 434 | 395 | 117.6 |
| D | 4 | 160 | 1130 | 6.25 | 434 | 395 | 117.6 |
Histogram calculated using DETX and DETY for each event in the final _common_clean file
| Quadrant A |  |
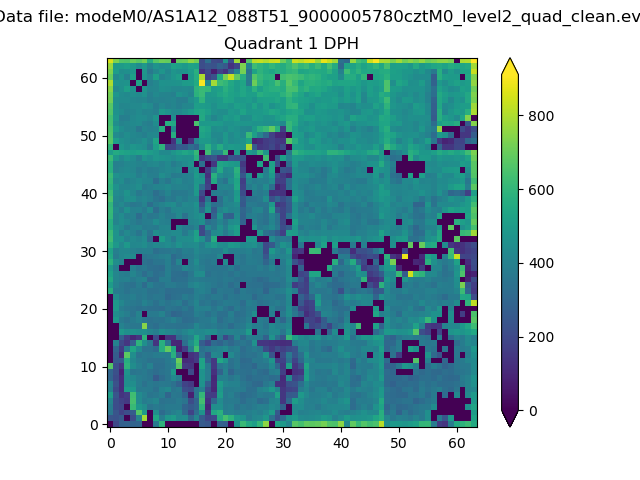 |
Quadrant B |
|---|---|---|---|
| Quadrant D |  |
 |
Quadrant C |
| Plot type | Count rate plots | Images |
|---|---|---|
| Comparison with Poisson distribution Blue bars denote a histogram of data divided into 1 sec bins. Red curve is a Poisson curve with rate = median count rate of data. |
 |
 |
| Quadrant-wise count rates Data is divided into 100 sec bins |
 |
|
| Module-wise count rates for Quadrant A Data is divided into 100 sec bins |
 |
 |
| Module-wise count rates for Quadrant B Data is divided into 100 sec bins |
 |
 |
| Module-wise count rates for Quadrant C Data is divided into 100 sec bins |
 |
 |
| Module-wise count rates for Quadrant D Data is divided into 100 sec bins |
 |
 |
| Parameter | Plot |
|---|---|
| CZT HV Monitor |  |
| D_VDD | 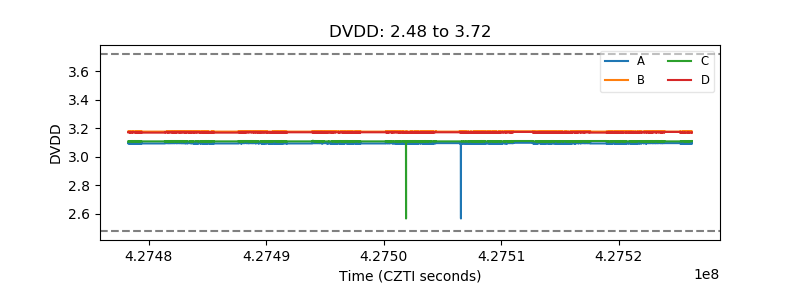 |
| Temperature 1 |  |
| Veto HV Monitor |  |
| Veto LLD |  |
| Alpha Counter |  |
| _CPM_Rate |  |
| CZT Counter |  |
| +2.5 Volts monitor |  |
| +5 Volts monitor | 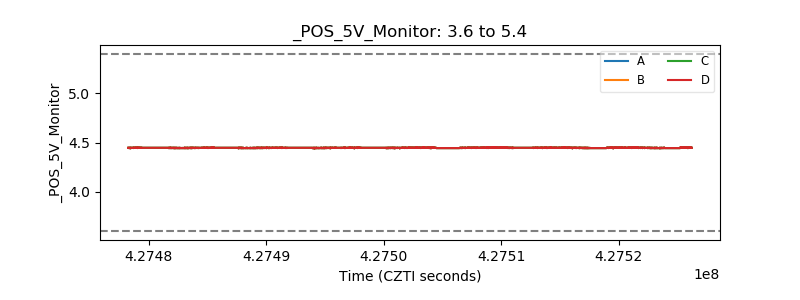 |
| _ROLL_ROT |  |
| _Roll_DEC |  |
| _Roll_RA | 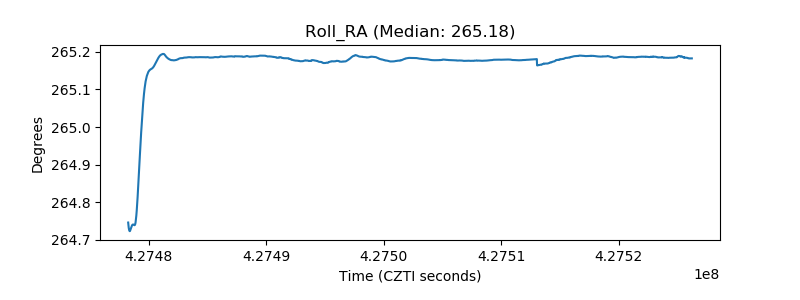 |
| Veto Counter |  |