| Param | Original file | Final file |
|---|---|---|
| Filename | modeM0/AS1A12_088T59_9000005774cztM0_level2.fits | modeM0/AS1A12_088T59_9000005774cztM0_level2_quad_clean.evt |
| Size (bytes) | 104,604,480 | 83,983,680 |
| Size | 99.8 MB | 80.1 MB |
| Events in quadrant A | 641,868 | 478,071 |
| Events in quadrant B | 616,664 | 473,435 |
| Events in quadrant C | 622,236 | 450,409 |
| Events in quadrant D | 511,104 | 364,466 |
| Mode SS | |||
|---|---|---|---|
| Quadrant | BADHDUFLAG | Total packets | Discarded packets |
| A | 0 | 230 | 0 |
| B | 0 | 230 | 0 |
| C | 0 | 230 | 0 |
| D | 0 | 230 | 0 |
| Mode M9 | |||
|---|---|---|---|
| Quadrant | BADHDUFLAG | Total packets | Discarded packets |
| A | 0 | 60 | 0 |
| B | 0 | 60 | 0 |
| C | 0 | 60 | 0 |
| D | 0 | 60 | 0 |
| Mode M0 | |||
|---|---|---|---|
| Quadrant | BADHDUFLAG | Total packets | Discarded packets |
| A | 0 | 25519 | 0 |
| B | 0 | 24185 | 0 |
| C | 0 | 22727 | 0 |
| D | 0 | 38146 | 0 |
| Quadrant | Total seconds | Saturated seconds | Saturation percentage |
|---|---|---|---|
| A | 11214 | 88 | 0.784733% |
| B | 11214 | 36 | 0.321027% |
| C | 11214 | 8 | 0.071339% |
| D | 11214 | 1018 | 9.077938% |
Noise dominated data is calculated using 1-second bins in cleaned event files. If a bin has >2000 counts, and if more than 50% of those come from <1% of pixels, then it is considered to be noise-dominated and hence unusable.
| Quadrant | # 1 sec bins | Bins with >0 counts | Bins with >2000 counts | High rate bins dominated by noise | Noise dominated (total time) | Noise dominated (detector-on time) | Marked lightcurve |
|---|---|---|---|---|---|---|---|
| A | 17192 | 11214 | 0 | 0 | 0.00% | 0.00% |  |
| B | 17192 | 11213 | 0 | 0 | 0.00% | 0.00% | 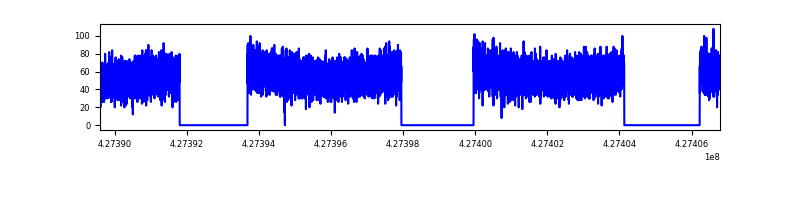 |
| C | 17192 | 11214 | 0 | 0 | 0.00% | 0.00% |  |
| D | 17192 | 11206 | 0 | 0 | 0.00% | 0.00% | 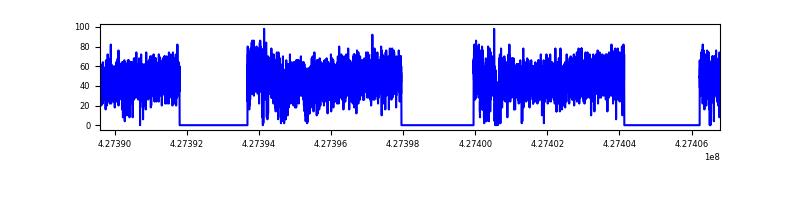 |
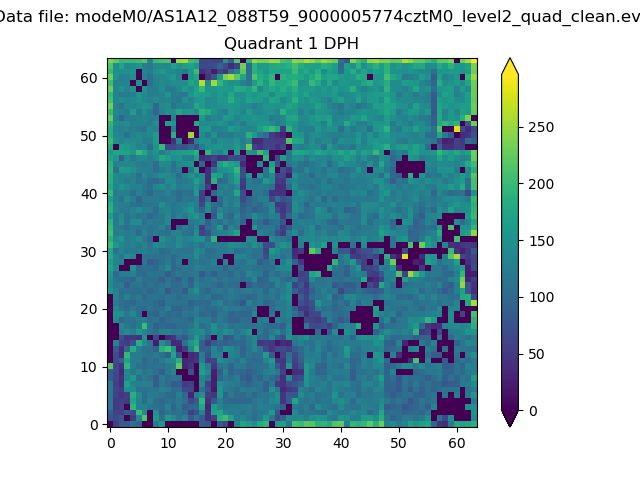
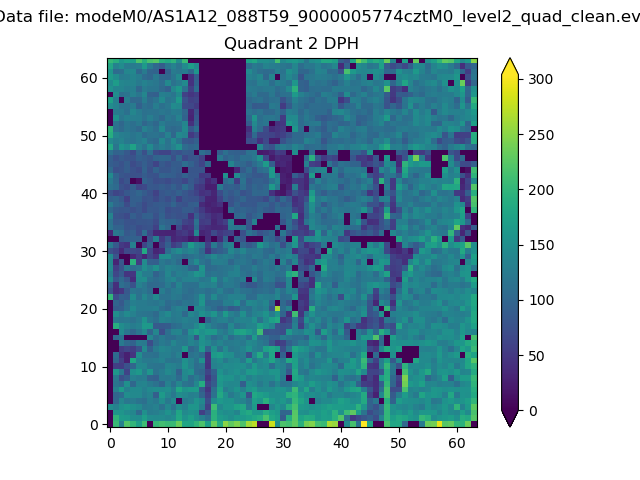
Top three noisy pixels from each quadrant. If the there are fewer than three noisy pixels in the level2.evt file, extra rows are filled as -1
| Pixel properties | Quadrant properties | ||||||
|---|---|---|---|---|---|---|---|
| Quadrant | DetID | PixID | Counts | Sigma | Mean | Median | Sigma |
| A | 7 | 110 | 536 | 8.65 | 167 | 158 | 43.7 |
| A | 0 | 29 | 528 | 8.46 | 167 | 158 | 43.7 |
| A | 14 | 95 | 510 | 8.05 | 167 | 158 | 43.7 |
| B | 2 | 9 | 560 | 11.87 | 163 | 156 | 34.0 |
| B | 3 | 80 | 457 | 8.85 | 163 | 156 | 34.0 |
| B | 5 | 128 | 451 | 8.67 | 163 | 156 | 34.0 |
| C | 1 | 80 | 538 | 8.58 | 164 | 154 | 44.7 |
| C | 1 | 81 | 516 | 8.09 | 164 | 154 | 44.7 |
| C | 3 | 203 | 489 | 7.49 | 164 | 154 | 44.7 |
| D | 6 | 62 | 399 | 6.55 | 146 | 133 | 40.6 |
| D | 6 | 231 | 384 | 6.18 | 146 | 133 | 40.6 |
| D | 7 | 3 | 383 | 6.16 | 146 | 133 | 40.6 |
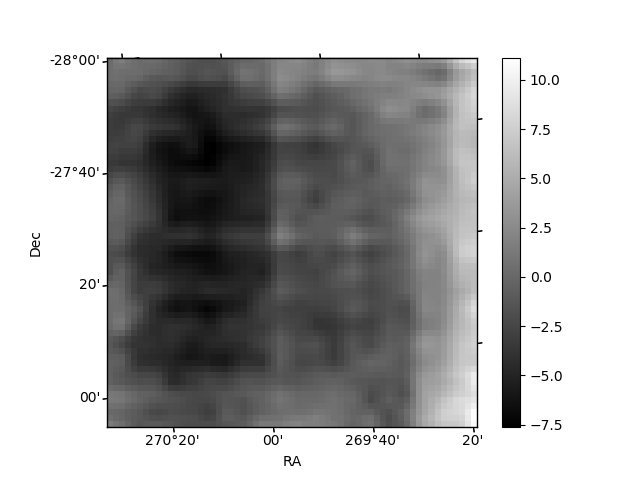
Histogram calculated using DETX and DETY for each event in the final _common_clean file
| Quadrant A |  |
 |
Quadrant B |
|---|---|---|---|
| Quadrant D |  |
 |
Quadrant C |
| Plot type | Count rate plots | Images |
|---|---|---|
| Comparison with Poisson distribution Blue bars denote a histogram of data divided into 1 sec bins. Red curve is a Poisson curve with rate = median count rate of data. |
 |
 |
| Quadrant-wise count rates Data is divided into 100 sec bins |
 |
|
| Module-wise count rates for Quadrant A Data is divided into 100 sec bins |
 |
 |
| Module-wise count rates for Quadrant B Data is divided into 100 sec bins |
 |
 |
| Module-wise count rates for Quadrant C Data is divided into 100 sec bins |
 |
 |
| Module-wise count rates for Quadrant D Data is divided into 100 sec bins |
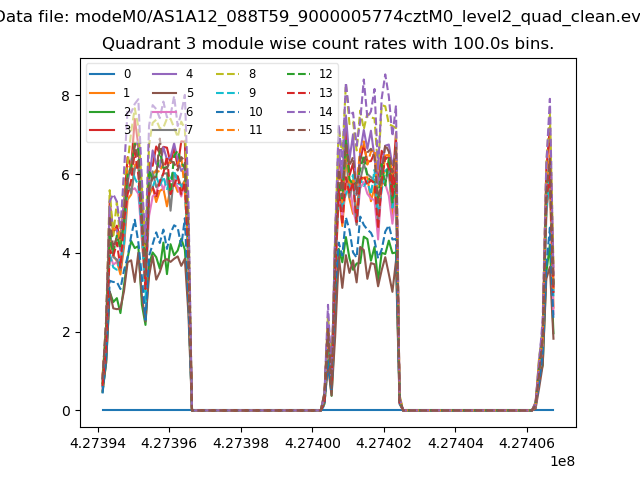 |
 |
| Parameter | Plot |
|---|---|
| CZT HV Monitor | 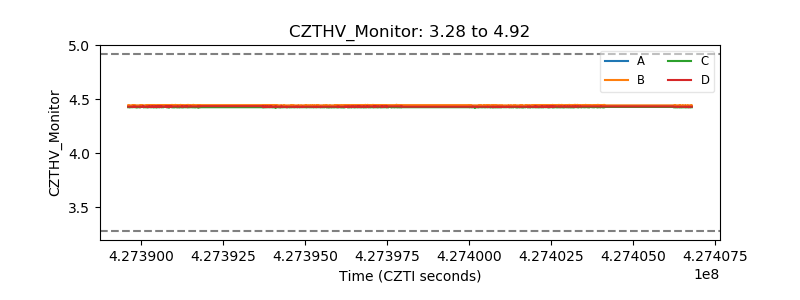 |
| D_VDD |  |
| Temperature 1 | 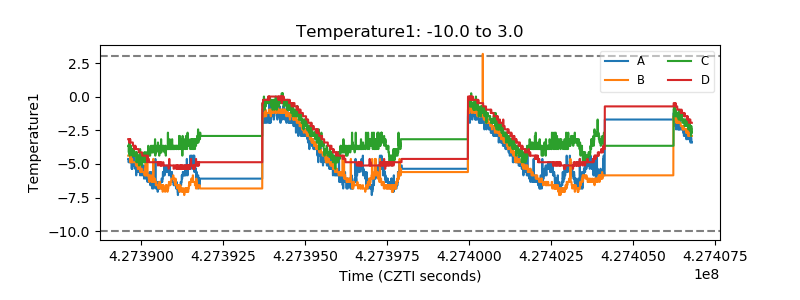 |
| Veto HV Monitor |  |
| Veto LLD |  |
| Alpha Counter |  |
| _CPM_Rate |  |
| CZT Counter |  |
| +2.5 Volts monitor |  |
| +5 Volts monitor |  |
| _ROLL_ROT |  |
| _Roll_DEC |  |
| _Roll_RA |  |
| Veto Counter |  |