| Param | Original file | Final file |
|---|---|---|
| Filename | modeM0/AS1A11_032T04_9000005766cztM0_level2.fits | modeM0/AS1A11_032T04_9000005766cztM0_level2_quad_clean.evt |
| Size (bytes) | 572,402,880 | 567,262,080 |
| Size | 545.9 MB | 541.0 MB |
| Events in quadrant A | 3,386,730 | 3,317,610 |
| Events in quadrant B | 3,289,066 | 3,341,283 |
| Events in quadrant C | 3,370,012 | 3,196,617 |
| Events in quadrant D | 2,882,192 | 2,917,247 |
| Mode M0 | |||
|---|---|---|---|
| Quadrant | BADHDUFLAG | Total packets | Discarded packets |
| A | 0 | 151831 | 0 |
| B | 0 | 136628 | 0 |
| C | 0 | 129263 | 0 |
| D | 0 | 157753 | 0 |
| Mode M9 | |||
|---|---|---|---|
| Quadrant | BADHDUFLAG | Total packets | Discarded packets |
| A | 0 | 262 | 0 |
| B | 0 | 262 | 0 |
| C | 0 | 263 | 0 |
| D | 0 | 263 | 0 |
| Mode SS | |||
|---|---|---|---|
| Quadrant | BADHDUFLAG | Total packets | Discarded packets |
| A | 0 | 1316 | 0 |
| B | 0 | 1316 | 0 |
| C | 0 | 1316 | 0 |
| D | 0 | 1316 | 0 |
| Quadrant | Total seconds | Saturated seconds | Saturation percentage |
|---|---|---|---|
| A | 64245 | 1279 | 1.990816% |
| B | 64246 | 570 | 0.887215% |
| C | 64246 | 29 | 0.045139% |
| D | 64246 | 1522 | 2.369019% |
Noise dominated data is calculated using 1-second bins in cleaned event files. If a bin has >2000 counts, and if more than 50% of those come from <1% of pixels, then it is considered to be noise-dominated and hence unusable.
| Quadrant | # 1 sec bins | Bins with >0 counts | Bins with >2000 counts | High rate bins dominated by noise | Noise dominated (total time) | Noise dominated (detector-on time) | Marked lightcurve |
|---|---|---|---|---|---|---|---|
| A | 116101 | 64216 | 0 | 0 | 0.00% | 0.00% |  |
| B | 116101 | 64211 | 0 | 0 | 0.00% | 0.00% |  |
| C | 116101 | 64247 | 0 | 0 | 0.00% | 0.00% |  |
| D | 116101 | 64200 | 0 | 0 | 0.00% | 0.00% | 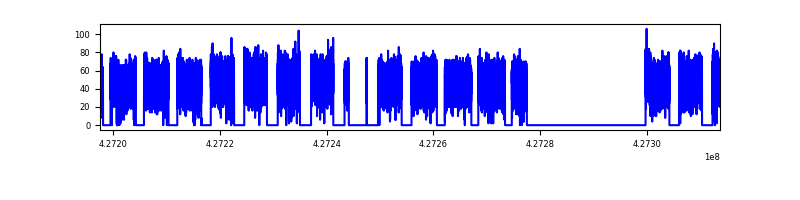 |
Top three noisy pixels from each quadrant. If the there are fewer than three noisy pixels in the level2.evt file, extra rows are filled as -1
| Pixel properties | Quadrant properties | ||||||
|---|---|---|---|---|---|---|---|
| Quadrant | DetID | PixID | Counts | Sigma | Mean | Median | Sigma |
| A | 7 | 110 | 2796 | 8.83 | 883 | 827 | 222.9 |
| A | 9 | 19 | 2790 | 8.81 | 883 | 827 | 222.9 |
| A | 0 | 29 | 2768 | 8.71 | 883 | 827 | 222.9 |
| B | 2 | 9 | 2871 | 12.13 | 868 | 827 | 168.6 |
| B | 3 | 80 | 2324 | 8.88 | 868 | 827 | 168.6 |
| B | 5 | 128 | 2301 | 8.74 | 868 | 827 | 168.6 |
| C | 1 | 81 | 2791 | 8.59 | 890 | 829 | 228.5 |
| C | 1 | 80 | 2728 | 8.31 | 890 | 829 | 228.5 |
| C | 3 | 202 | 2686 | 8.13 | 890 | 829 | 228.5 |
| D | 4 | 160 | 2180 | 6.41 | 826 | 752 | 222.7 |
| D | 10 | 189 | 2174 | 6.38 | 826 | 752 | 222.7 |
| D | 10 | 113 | 2103 | 6.06 | 826 | 752 | 222.7 |
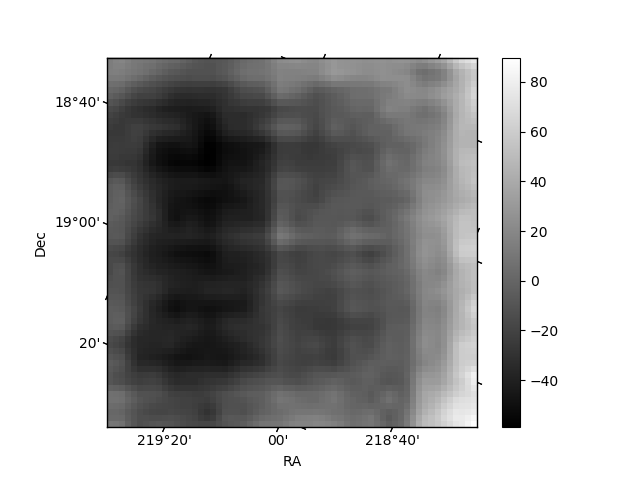
Histogram calculated using DETX and DETY for each event in the final _common_clean file
| Quadrant A | 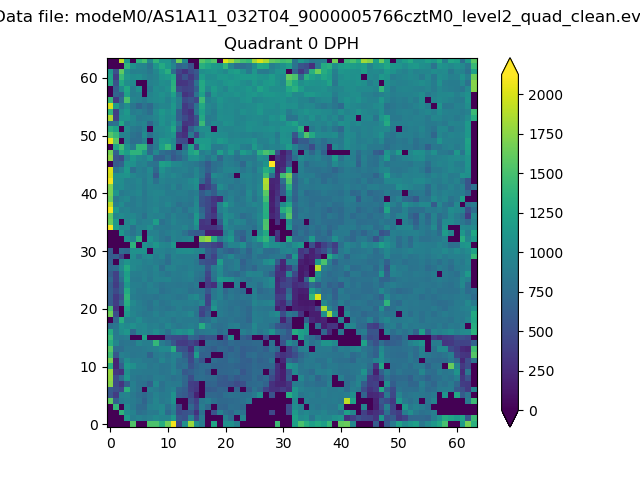 |
 |
Quadrant B |
|---|---|---|---|
| Quadrant D |  |
 |
Quadrant C |
| Plot type | Count rate plots | Images |
|---|---|---|
| Comparison with Poisson distribution Blue bars denote a histogram of data divided into 1 sec bins. Red curve is a Poisson curve with rate = median count rate of data. |
 |
 |
| Quadrant-wise count rates Data is divided into 100 sec bins |
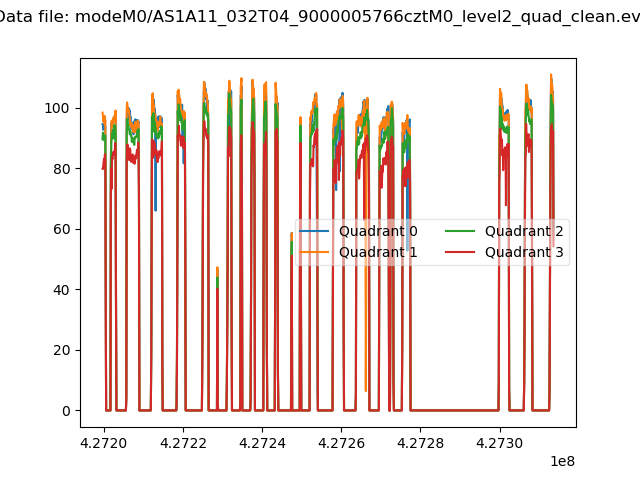 |
|
| Module-wise count rates for Quadrant A Data is divided into 100 sec bins |
 |
 |
| Module-wise count rates for Quadrant B Data is divided into 100 sec bins |
 |
 |
| Module-wise count rates for Quadrant C Data is divided into 100 sec bins |
 |
 |
| Module-wise count rates for Quadrant D Data is divided into 100 sec bins |
 |
 |
| Parameter | Plot |
|---|---|
| CZT HV Monitor | 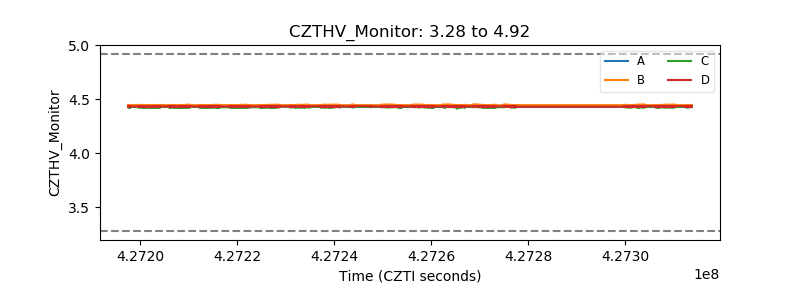 |
| D_VDD | 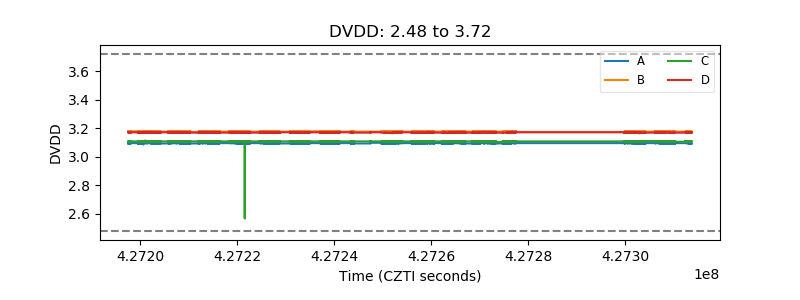 |
| Temperature 1 |  |
| Veto HV Monitor |  |
| Veto LLD | 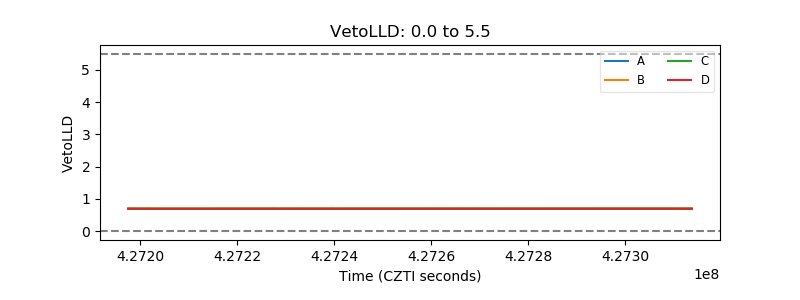 |
| Alpha Counter |  |
| _CPM_Rate |  |
| CZT Counter |  |
| +2.5 Volts monitor |  |
| +5 Volts monitor |  |
| _ROLL_ROT |  |
| _Roll_DEC |  |
| _Roll_RA | 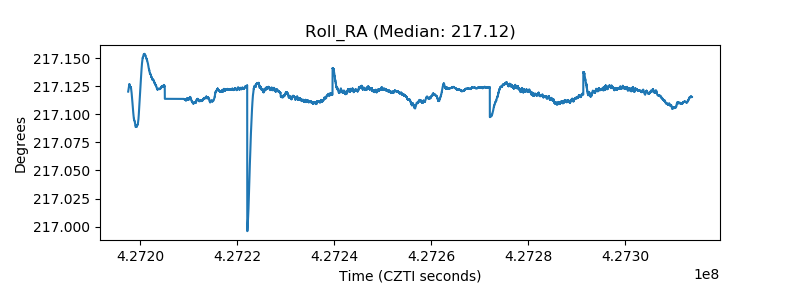 |
| Veto Counter |  |