| Param | Original file | Final file |
|---|---|---|
| Filename | modeM0/AS1A12_061T07_9000005752cztM0_level2.fits | modeM0/AS1A12_061T07_9000005752cztM0_level2_quad_clean.evt |
| Size (bytes) | 216,282,240 | 207,938,880 |
| Size | 206.3 MB | 198.3 MB |
| Events in quadrant A | 1,308,488 | 1,237,937 |
| Events in quadrant B | 1,263,274 | 1,254,797 |
| Events in quadrant C | 1,286,946 | 1,173,595 |
| Events in quadrant D | 1,100,368 | 1,039,653 |
| Mode M0 | |||
|---|---|---|---|
| Quadrant | BADHDUFLAG | Total packets | Discarded packets |
| A | 0 | 49710 | 0 |
| B | 0 | 49095 | 0 |
| C | 0 | 46905 | 0 |
| D | 0 | 60028 | 0 |
| Mode SS | |||
|---|---|---|---|
| Quadrant | BADHDUFLAG | Total packets | Discarded packets |
| A | 0 | 474 | 0 |
| B | 0 | 474 | 0 |
| C | 0 | 474 | 0 |
| D | 0 | 474 | 0 |
| Mode M9 | |||
|---|---|---|---|
| Quadrant | BADHDUFLAG | Total packets | Discarded packets |
| A | 0 | 103 | 0 |
| B | 0 | 104 | 0 |
| C | 0 | 104 | 0 |
| D | 0 | 104 | 0 |
| Quadrant | Total seconds | Saturated seconds | Saturation percentage |
|---|---|---|---|
| A | 23123 | 42 | 0.181637% |
| B | 23122 | 118 | 0.510336% |
| C | 23122 | 18 | 0.077848% |
| D | 23122 | 862 | 3.728051% |
Noise dominated data is calculated using 1-second bins in cleaned event files. If a bin has >2000 counts, and if more than 50% of those come from <1% of pixels, then it is considered to be noise-dominated and hence unusable.
| Quadrant | # 1 sec bins | Bins with >0 counts | Bins with >2000 counts | High rate bins dominated by noise | Noise dominated (total time) | Noise dominated (detector-on time) | Marked lightcurve |
|---|---|---|---|---|---|---|---|
| A | 37787 | 23123 | 0 | 0 | 0.00% | 0.00% | 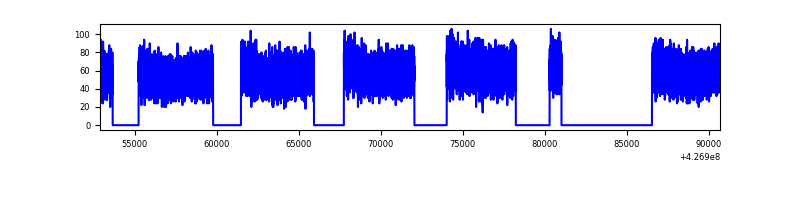 |
| B | 37787 | 23122 | 0 | 0 | 0.00% | 0.00% |  |
| C | 37787 | 23122 | 0 | 0 | 0.00% | 0.00% |  |
| D | 37787 | 23098 | 0 | 0 | 0.00% | 0.00% |  |
Top three noisy pixels from each quadrant. If the there are fewer than three noisy pixels in the level2.evt file, extra rows are filled as -1
| Pixel properties | Quadrant properties | ||||||
|---|---|---|---|---|---|---|---|
| Quadrant | DetID | PixID | Counts | Sigma | Mean | Median | Sigma |
| A | 0 | 29 | 1095 | 8.94 | 341 | 322 | 86.4 |
| A | 9 | 19 | 1076 | 8.72 | 341 | 322 | 86.4 |
| A | 7 | 110 | 1033 | 8.22 | 341 | 322 | 86.4 |
| B | 2 | 9 | 1006 | 10.33 | 334 | 320 | 66.4 |
| B | 5 | 128 | 891 | 8.6 | 334 | 320 | 66.4 |
| B | 3 | 80 | 873 | 8.33 | 334 | 320 | 66.4 |
| C | 1 | 81 | 998 | 7.66 | 340 | 319 | 88.7 |
| C | 1 | 80 | 972 | 7.36 | 340 | 319 | 88.7 |
| C | 3 | 234 | 876 | 6.28 | 340 | 319 | 88.7 |
| D | 10 | 189 | 822 | 6.34 | 313 | 286 | 84.5 |
| D | 4 | 160 | 821 | 6.33 | 313 | 286 | 84.5 |
| D | 7 | 3 | 812 | 6.23 | 313 | 286 | 84.5 |
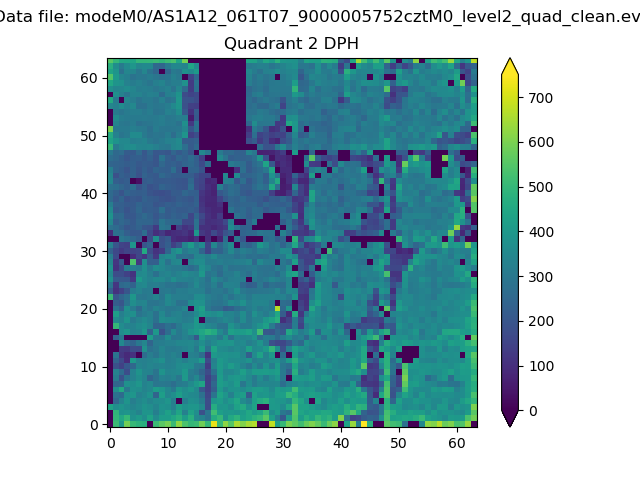
Histogram calculated using DETX and DETY for each event in the final _common_clean file
| Quadrant A |  |
 |
Quadrant B |
|---|---|---|---|
| Quadrant D | 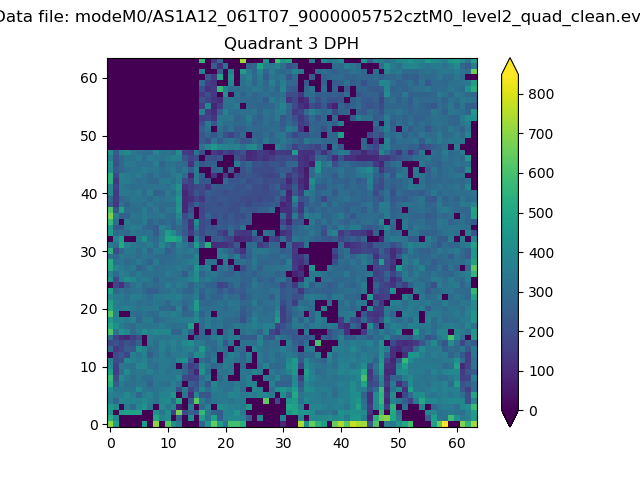 |
 |
Quadrant C |
| Plot type | Count rate plots | Images |
|---|---|---|
| Comparison with Poisson distribution Blue bars denote a histogram of data divided into 1 sec bins. Red curve is a Poisson curve with rate = median count rate of data. |
 |
 |
| Quadrant-wise count rates Data is divided into 100 sec bins |
 |
|
| Module-wise count rates for Quadrant A Data is divided into 100 sec bins |
 |
 |
| Module-wise count rates for Quadrant B Data is divided into 100 sec bins |
 |
 |
| Module-wise count rates for Quadrant C Data is divided into 100 sec bins |
 |
 |
| Module-wise count rates for Quadrant D Data is divided into 100 sec bins |
 |
 |
| Parameter | Plot |
|---|---|
| CZT HV Monitor |  |
| D_VDD |  |
| Temperature 1 |  |
| Veto HV Monitor |  |
| Veto LLD |  |
| Alpha Counter | 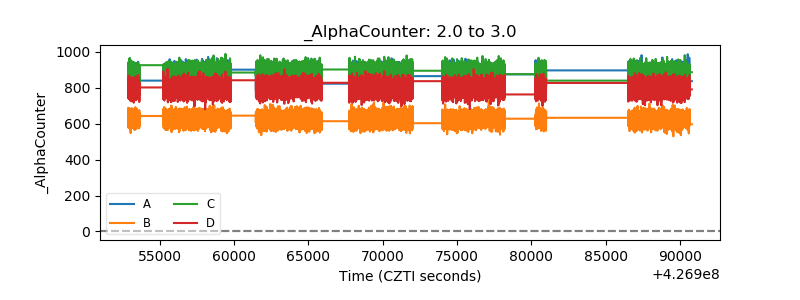 |
| _CPM_Rate |  |
| CZT Counter |  |
| +2.5 Volts monitor | 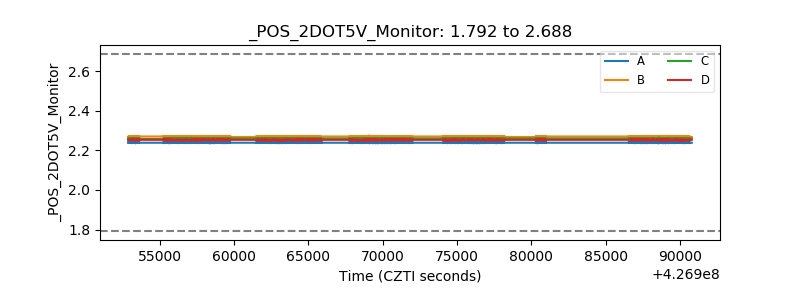 |
| +5 Volts monitor |  |
| _ROLL_ROT |  |
| _Roll_DEC |  |
| _Roll_RA |  |
| Veto Counter |  |