| Param | Original file | Final file |
|---|---|---|
| Filename | modeM0/AS1A12_044T22_9000005750cztM0_level2.fits | modeM0/AS1A12_044T22_9000005750cztM0_level2_quad_clean.evt |
| Size (bytes) | 719,988,480 | 757,333,440 |
| Size | 686.6 MB | 722.2 MB |
| Events in quadrant A | 4,143,262 | 4,364,578 |
| Events in quadrant B | 4,181,754 | 4,658,338 |
| Events in quadrant C | 4,292,532 | 4,426,017 |
| Events in quadrant D | 3,593,088 | 3,897,884 |
| Mode M0 | |||
|---|---|---|---|
| Quadrant | BADHDUFLAG | Total packets | Discarded packets |
| A | 0 | 283309 | 0 |
| B | 0 | 168964 | 0 |
| C | 0 | 165717 | 0 |
| D | 0 | 227287 | 0 |
| Mode M9 | |||
|---|---|---|---|
| Quadrant | BADHDUFLAG | Total packets | Discarded packets |
| A | 0 | 287 | 0 |
| B | 0 | 285 | 0 |
| C | 0 | 286 | 0 |
| D | 0 | 285 | 0 |
| Mode SS | |||
|---|---|---|---|
| Quadrant | BADHDUFLAG | Total packets | Discarded packets |
| A | 0 | 1666 | 0 |
| B | 0 | 1668 | 0 |
| C | 0 | 1668 | 0 |
| D | 0 | 1666 | 0 |
| Quadrant | Total seconds | Saturated seconds | Saturation percentage |
|---|---|---|---|
| A | 81503 | 6596 | 8.092954% |
| B | 81524 | 497 | 0.609636% |
| C | 81538 | 131 | 0.160661% |
| D | 81503 | 5480 | 6.723679% |
Noise dominated data is calculated using 1-second bins in cleaned event files. If a bin has >2000 counts, and if more than 50% of those come from <1% of pixels, then it is considered to be noise-dominated and hence unusable.
| Quadrant | # 1 sec bins | Bins with >0 counts | Bins with >2000 counts | High rate bins dominated by noise | Noise dominated (total time) | Noise dominated (detector-on time) | Marked lightcurve |
|---|---|---|---|---|---|---|---|
| A | 109585 | 81511 | 0 | 0 | 0.00% | 0.00% |  |
| B | 109585 | 81543 | 0 | 0 | 0.00% | 0.00% |  |
| C | 109585 | 81561 | 0 | 0 | 0.00% | 0.00% |  |
| D | 109585 | 81323 | 0 | 0 | 0.00% | 0.00% |  |
Top three noisy pixels from each quadrant. If the there are fewer than three noisy pixels in the level2.evt file, extra rows are filled as -1
| Pixel properties | Quadrant properties | ||||||
|---|---|---|---|---|---|---|---|
| Quadrant | DetID | PixID | Counts | Sigma | Mean | Median | Sigma |
| A | 7 | 110 | 3477 | 9.15 | 1079 | 1005 | 270.2 |
| A | 9 | 19 | 3327 | 8.59 | 1079 | 1005 | 270.2 |
| A | 0 | 29 | 3250 | 8.31 | 1079 | 1005 | 270.2 |
| B | 2 | 9 | 3651 | 12.16 | 1102 | 1048 | 214.0 |
| B | 3 | 80 | 3083 | 9.51 | 1102 | 1048 | 214.0 |
| B | 3 | 17 | 2961 | 8.94 | 1102 | 1048 | 214.0 |
| C | 1 | 81 | 3528 | 8.54 | 1132 | 1057 | 289.2 |
| C | 1 | 80 | 3339 | 7.89 | 1132 | 1057 | 289.2 |
| C | 3 | 202 | 3297 | 7.75 | 1132 | 1057 | 289.2 |
| D | 7 | 3 | 2649 | 6.27 | 1027 | 934 | 273.4 |
| D | 4 | 160 | 2646 | 6.26 | 1027 | 934 | 273.4 |
| D | 10 | 189 | 2583 | 6.03 | 1027 | 934 | 273.4 |
Histogram calculated using DETX and DETY for each event in the final _common_clean file
| Quadrant A |  |
 |
Quadrant B |
|---|---|---|---|
| Quadrant D |  |
 |
Quadrant C |
| Plot type | Count rate plots | Images |
|---|---|---|
| Comparison with Poisson distribution Blue bars denote a histogram of data divided into 1 sec bins. Red curve is a Poisson curve with rate = median count rate of data. |
 |
 |
| Quadrant-wise count rates Data is divided into 100 sec bins |
 |
|
| Module-wise count rates for Quadrant A Data is divided into 100 sec bins |
 |
 |
| Module-wise count rates for Quadrant B Data is divided into 100 sec bins |
 |
 |
| Module-wise count rates for Quadrant C Data is divided into 100 sec bins |
 |
 |
| Module-wise count rates for Quadrant D Data is divided into 100 sec bins |
 |
 |
| Parameter | Plot |
|---|---|
| CZT HV Monitor |  |
| D_VDD |  |
| Temperature 1 |  |
| Veto HV Monitor |  |
| Veto LLD |  |
| Alpha Counter |  |
| _CPM_Rate |  |
| CZT Counter |  |
| +2.5 Volts monitor |  |
| +5 Volts monitor |  |
| _ROLL_ROT |  |
| _Roll_DEC | 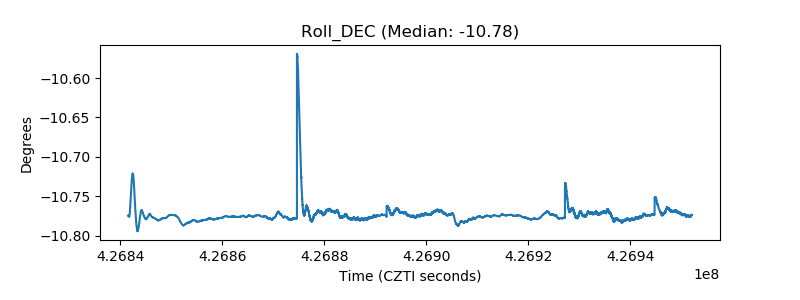 |
| _Roll_RA |  |
| Veto Counter |  |