| Param | Original file | Final file |
|---|---|---|
| Filename | modeM0/AS1A12_044T22_9000005740cztM0_level2.fits | modeM0/AS1A12_044T22_9000005740cztM0_level2_quad_clean.evt |
| Size (bytes) | 169,689,600 | 216,512,640 |
| Size | 161.8 MB | 206.5 MB |
| Events in quadrant A | 995,864 | 1,360,949 |
| Events in quadrant B | 982,994 | 1,393,446 |
| Events in quadrant C | 1,009,094 | 1,319,687 |
| Events in quadrant D | 867,156 | 1,199,039 |
| Mode M0 | |||
|---|---|---|---|
| Quadrant | BADHDUFLAG | Total packets | Discarded packets |
| A | 0 | 55505 | 0 |
| B | 0 | 38439 | 0 |
| C | 0 | 37611 | 0 |
| D | 0 | 42554 | 0 |
| Mode SS | |||
|---|---|---|---|
| Quadrant | BADHDUFLAG | Total packets | Discarded packets |
| A | 0 | 382 | 0 |
| B | 0 | 382 | 0 |
| C | 0 | 382 | 0 |
| D | 0 | 382 | 0 |
| Mode M9 | |||
|---|---|---|---|
| Quadrant | BADHDUFLAG | Total packets | Discarded packets |
| A | 0 | 88 | 0 |
| B | 0 | 88 | 0 |
| C | 0 | 88 | 0 |
| D | 0 | 88 | 0 |
| Quadrant | Total seconds | Saturated seconds | Saturation percentage |
|---|---|---|---|
| A | 18637 | 527 | 2.827708% |
| B | 18637 | 89 | 0.477545% |
| C | 18637 | 14 | 0.075119% |
| D | 18637 | 319 | 1.711649% |
Noise dominated data is calculated using 1-second bins in cleaned event files. If a bin has >2000 counts, and if more than 50% of those come from <1% of pixels, then it is considered to be noise-dominated and hence unusable.
| Quadrant | # 1 sec bins | Bins with >0 counts | Bins with >2000 counts | High rate bins dominated by noise | Noise dominated (total time) | Noise dominated (detector-on time) | Marked lightcurve |
|---|---|---|---|---|---|---|---|
| A | 27449 | 18637 | 0 | 0 | 0.00% | 0.00% |  |
| B | 27449 | 18637 | 0 | 0 | 0.00% | 0.00% |  |
| C | 27449 | 18637 | 0 | 0 | 0.00% | 0.00% |  |
| D | 27449 | 18633 | 0 | 0 | 0.00% | 0.00% |  |
Top three noisy pixels from each quadrant. If the there are fewer than three noisy pixels in the level2.evt file, extra rows are filled as -1
| Pixel properties | Quadrant properties | ||||||
|---|---|---|---|---|---|---|---|
| Quadrant | DetID | PixID | Counts | Sigma | Mean | Median | Sigma |
| A | 7 | 110 | 846 | 8.85 | 259 | 242 | 68.3 |
| A | 0 | 29 | 795 | 8.1 | 259 | 242 | 68.3 |
| A | 14 | 95 | 783 | 7.92 | 259 | 242 | 68.3 |
| B | 2 | 9 | 902 | 12.05 | 259 | 246 | 54.4 |
| B | 2 | 8 | 729 | 8.87 | 259 | 246 | 54.4 |
| B | 4 | 146 | 679 | 7.95 | 259 | 246 | 54.4 |
| C | 1 | 81 | 811 | 8.06 | 266 | 250 | 69.6 |
| C | 1 | 80 | 762 | 7.36 | 266 | 250 | 69.6 |
| C | 3 | 202 | 748 | 7.16 | 266 | 250 | 69.6 |
| D | 6 | 231 | 671 | 6.57 | 248 | 226 | 67.7 |
| D | 7 | 3 | 664 | 6.47 | 248 | 226 | 67.7 |
| D | 6 | 67 | 652 | 6.29 | 248 | 226 | 67.7 |
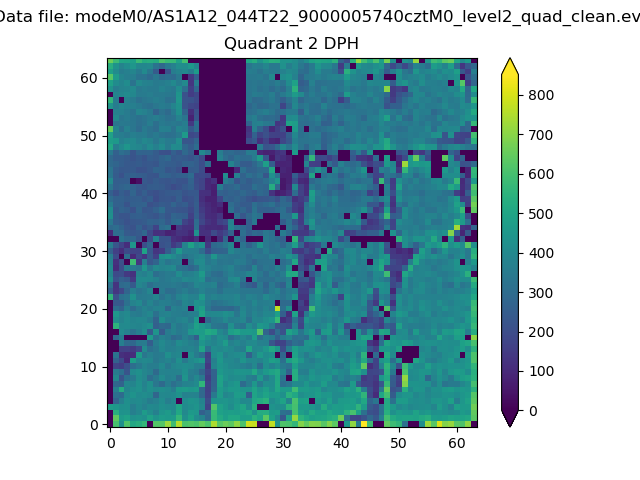
Histogram calculated using DETX and DETY for each event in the final _common_clean file
| Quadrant A |  |
 |
Quadrant B |
|---|---|---|---|
| Quadrant D |  |
 |
Quadrant C |
| Plot type | Count rate plots | Images |
|---|---|---|
| Comparison with Poisson distribution Blue bars denote a histogram of data divided into 1 sec bins. Red curve is a Poisson curve with rate = median count rate of data. |
 |
 |
| Quadrant-wise count rates Data is divided into 100 sec bins |
 |
|
| Module-wise count rates for Quadrant A Data is divided into 100 sec bins |
 |
 |
| Module-wise count rates for Quadrant B Data is divided into 100 sec bins |
 |
 |
| Module-wise count rates for Quadrant C Data is divided into 100 sec bins |
 |
 |
| Module-wise count rates for Quadrant D Data is divided into 100 sec bins |
 |
 |
| Parameter | Plot |
|---|---|
| CZT HV Monitor |  |
| D_VDD |  |
| Temperature 1 |  |
| Veto HV Monitor |  |
| Veto LLD |  |
| Alpha Counter |  |
| _CPM_Rate |  |
| CZT Counter | 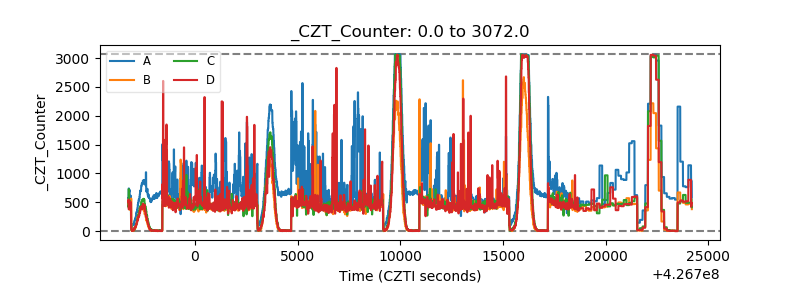 |
| +2.5 Volts monitor |  |
| +5 Volts monitor |  |
| _ROLL_ROT |  |
| _Roll_DEC |  |
| _Roll_RA |  |
| Veto Counter |  |