| Param | Original file | Final file |
|---|---|---|
| Filename | modeM0/AS1A12_011T26_9000005732cztM0_level2.fits | modeM0/AS1A12_011T26_9000005732cztM0_level2_quad_clean.evt |
| Size (bytes) | 590,316,480 | 658,365,120 |
| Size | 563.0 MB | 627.9 MB |
| Events in quadrant A | 3,511,612 | 4,028,046 |
| Events in quadrant B | 3,368,702 | 3,989,859 |
| Events in quadrant C | 3,476,232 | 3,883,981 |
| Events in quadrant D | 2,911,772 | 3,430,102 |
| Mode M0 | |||
|---|---|---|---|
| Quadrant | BADHDUFLAG | Total packets | Discarded packets |
| A | 0 | 154654 | 0 |
| B | 0 | 151711 | 0 |
| C | 0 | 135592 | 0 |
| D | 0 | 185319 | 0 |
| Mode M9 | |||
|---|---|---|---|
| Quadrant | BADHDUFLAG | Total packets | Discarded packets |
| A | 0 | 253 | 0 |
| B | 0 | 253 | 0 |
| C | 0 | 254 | 0 |
| D | 0 | 254 | 0 |
| Mode SS | |||
|---|---|---|---|
| Quadrant | BADHDUFLAG | Total packets | Discarded packets |
| A | 0 | 1376 | 0 |
| B | 0 | 1376 | 0 |
| C | 0 | 1376 | 0 |
| D | 0 | 1376 | 0 |
| Quadrant | Total seconds | Saturated seconds | Saturation percentage |
|---|---|---|---|
| A | 67179 | 532 | 0.791914% |
| B | 67178 | 1363 | 2.028938% |
| C | 67179 | 48 | 0.071451% |
| D | 67176 | 3555 | 5.292069% |
Noise dominated data is calculated using 1-second bins in cleaned event files. If a bin has >2000 counts, and if more than 50% of those come from <1% of pixels, then it is considered to be noise-dominated and hence unusable.
| Quadrant | # 1 sec bins | Bins with >0 counts | Bins with >2000 counts | High rate bins dominated by noise | Noise dominated (total time) | Noise dominated (detector-on time) | Marked lightcurve |
|---|---|---|---|---|---|---|---|
| A | 97740 | 67176 | 0 | 0 | 0.00% | 0.00% | 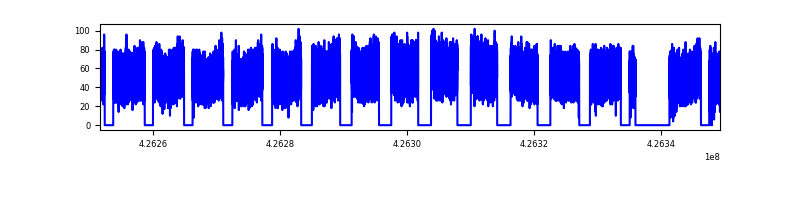 |
| B | 97740 | 67124 | 0 | 0 | 0.00% | 0.00% |  |
| C | 97740 | 67178 | 0 | 0 | 0.00% | 0.00% |  |
| D | 97740 | 67119 | 0 | 0 | 0.00% | 0.00% |  |
Top three noisy pixels from each quadrant. If the there are fewer than three noisy pixels in the level2.evt file, extra rows are filled as -1
| Pixel properties | Quadrant properties | ||||||
|---|---|---|---|---|---|---|---|
| Quadrant | DetID | PixID | Counts | Sigma | Mean | Median | Sigma |
| A | 0 | 29 | 2938 | 9.11 | 917 | 858 | 228.3 |
| A | 7 | 110 | 2924 | 9.05 | 917 | 858 | 228.3 |
| A | 9 | 19 | 2899 | 8.94 | 917 | 858 | 228.3 |
| B | 2 | 9 | 2895 | 11.7 | 892 | 851 | 174.6 |
| B | 5 | 128 | 2371 | 8.7 | 892 | 851 | 174.6 |
| B | 3 | 80 | 2356 | 8.62 | 892 | 851 | 174.6 |
| C | 1 | 81 | 2922 | 8.69 | 917 | 855 | 237.8 |
| C | 3 | 202 | 2729 | 7.88 | 917 | 855 | 237.8 |
| C | 1 | 80 | 2716 | 7.82 | 917 | 855 | 237.8 |
| D | 10 | 189 | 2221 | 6.49 | 834 | 760 | 225.1 |
| D | 7 | 3 | 2177 | 6.29 | 834 | 760 | 225.1 |
| D | 4 | 160 | 2126 | 6.07 | 834 | 760 | 225.1 |
Histogram calculated using DETX and DETY for each event in the final _common_clean file
| Quadrant A |  |
 |
Quadrant B |
|---|---|---|---|
| Quadrant D | 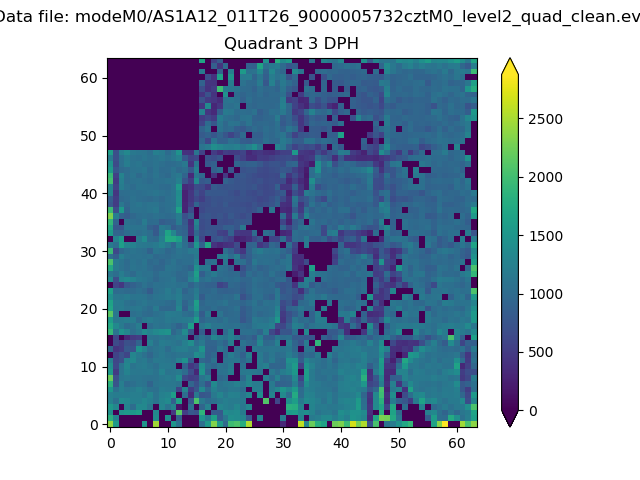 |
 |
Quadrant C |
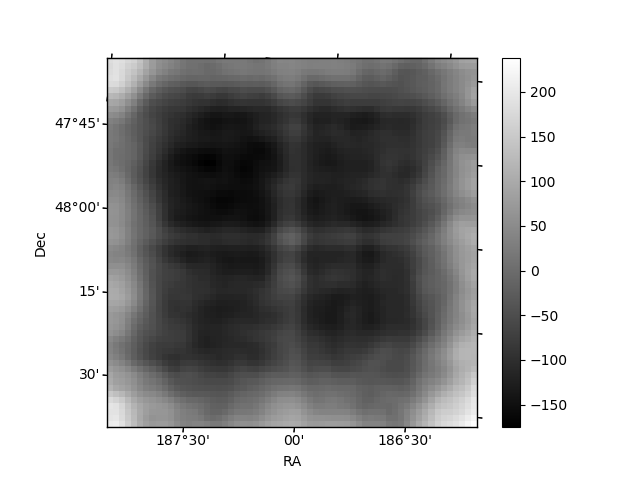
| Plot type | Count rate plots | Images |
|---|---|---|
| Comparison with Poisson distribution Blue bars denote a histogram of data divided into 1 sec bins. Red curve is a Poisson curve with rate = median count rate of data. |
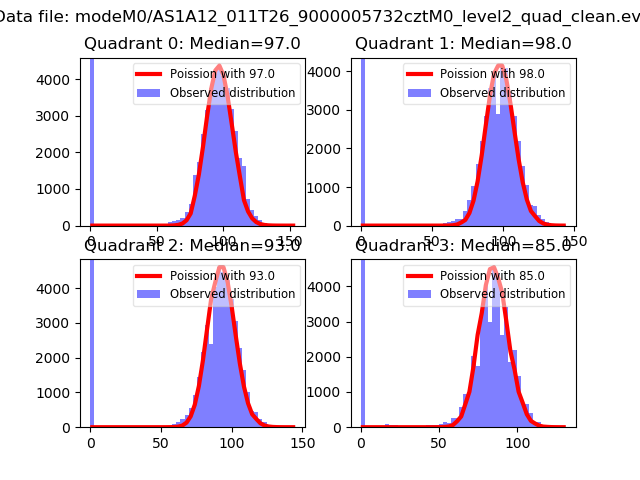 |
 |
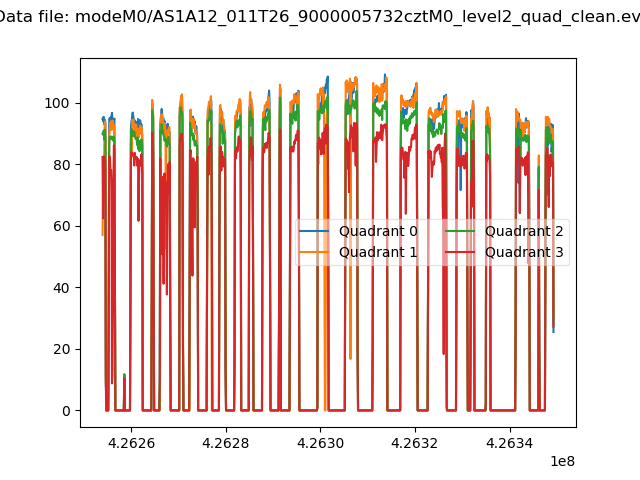
| Quadrant-wise count rates Data is divided into 100 sec bins |
 |
|
| Module-wise count rates for Quadrant A Data is divided into 100 sec bins |
 |
 |
| Module-wise count rates for Quadrant B Data is divided into 100 sec bins |
 |
 |
| Module-wise count rates for Quadrant C Data is divided into 100 sec bins |
 |
 |
| Module-wise count rates for Quadrant D Data is divided into 100 sec bins |
 |
 |
| Parameter | Plot |
|---|---|
| CZT HV Monitor |  |
| D_VDD | 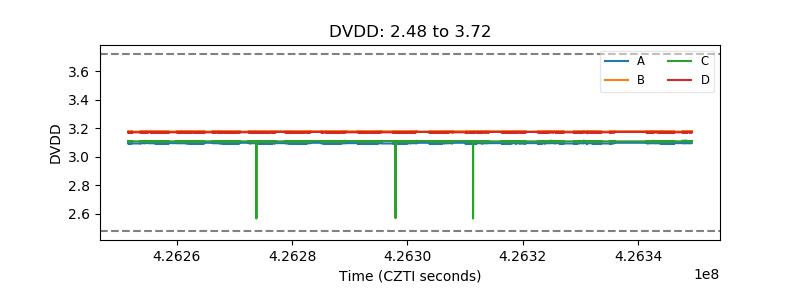 |
| Temperature 1 |  |
| Veto HV Monitor |  |
| Veto LLD | 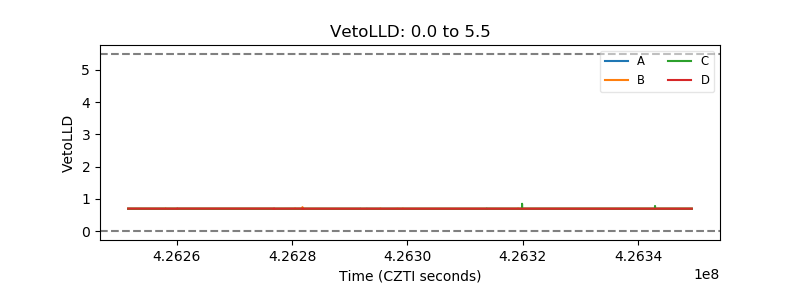 |
| Alpha Counter |  |
| _CPM_Rate | 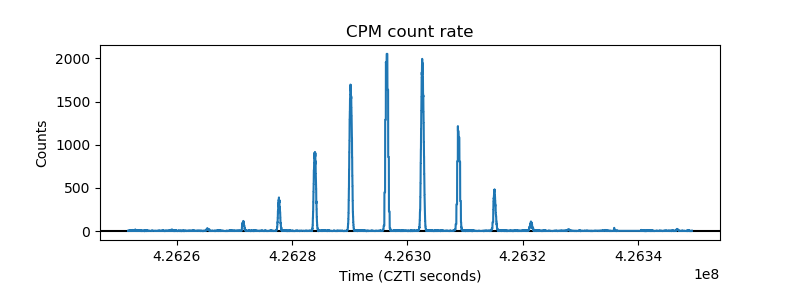 |
| CZT Counter |  |
| +2.5 Volts monitor |  |
| +5 Volts monitor |  |
| _ROLL_ROT |  |
| _Roll_DEC |  |
| _Roll_RA |  |
| Veto Counter | 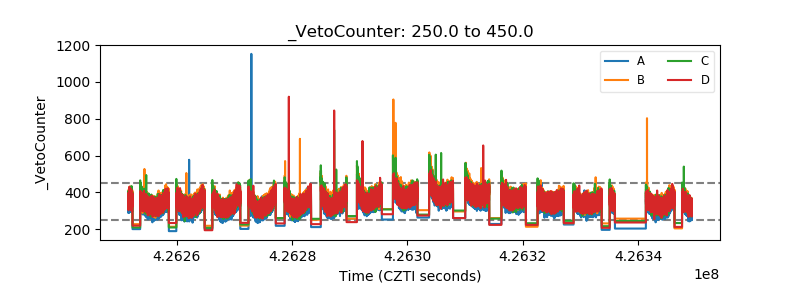 |