| Param | Original file | Final file |
|---|---|---|
| Filename | modeM0/AS1A12_104T01_9000005728cztM0_level2.fits | modeM0/AS1A12_104T01_9000005728cztM0_level2_quad_clean.evt |
| Size (bytes) | 818,498,880 | 946,909,440 |
| Size | 780.6 MB | 903.0 MB |
| Events in quadrant A | 4,873,594 | 5,841,571 |
| Events in quadrant B | 4,684,660 | 5,824,333 |
| Events in quadrant C | 4,786,728 | 5,593,235 |
| Events in quadrant D | 4,078,716 | 5,056,084 |
| Mode SS | |||
|---|---|---|---|
| Quadrant | BADHDUFLAG | Total packets | Discarded packets |
| A | 0 | 1902 | 0 |
| B | 0 | 1902 | 0 |
| C | 0 | 1902 | 0 |
| D | 0 | 1902 | 0 |
| Mode M0 | |||
|---|---|---|---|
| Quadrant | BADHDUFLAG | Total packets | Discarded packets |
| A | 0 | 199296 | 0 |
| B | 0 | 190847 | 0 |
| C | 0 | 186790 | 0 |
| D | 0 | 231908 | 0 |
| Mode M9 | |||
|---|---|---|---|
| Quadrant | BADHDUFLAG | Total packets | Discarded packets |
| A | 0 | 341 | 0 |
| B | 0 | 341 | 0 |
| C | 0 | 341 | 0 |
| D | 0 | 341 | 0 |
| Quadrant | Total seconds | Saturated seconds | Saturation percentage |
|---|---|---|---|
| A | 92836 | 216 | 0.232668% |
| B | 92836 | 289 | 0.311302% |
| C | 92836 | 62 | 0.066784% |
| D | 92835 | 2524 | 2.718802% |
Noise dominated data is calculated using 1-second bins in cleaned event files. If a bin has >2000 counts, and if more than 50% of those come from <1% of pixels, then it is considered to be noise-dominated and hence unusable.
| Quadrant | # 1 sec bins | Bins with >0 counts | Bins with >2000 counts | High rate bins dominated by noise | Noise dominated (total time) | Noise dominated (detector-on time) | Marked lightcurve |
|---|---|---|---|---|---|---|---|
| A | 125575 | 92836 | 0 | 0 | 0.00% | 0.00% | 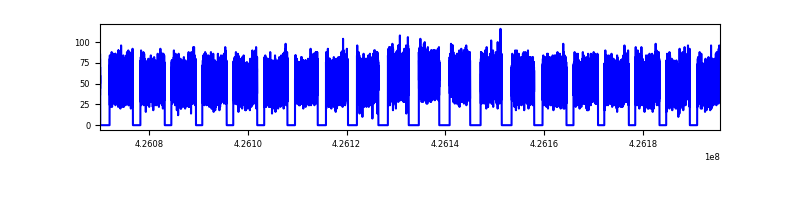 |
| B | 125575 | 92837 | 0 | 0 | 0.00% | 0.00% |  |
| C | 125575 | 92837 | 0 | 0 | 0.00% | 0.00% |  |
| D | 125575 | 92791 | 0 | 0 | 0.00% | 0.00% |  |
Top three noisy pixels from each quadrant. If the there are fewer than three noisy pixels in the level2.evt file, extra rows are filled as -1
| Pixel properties | Quadrant properties | ||||||
|---|---|---|---|---|---|---|---|
| Quadrant | DetID | PixID | Counts | Sigma | Mean | Median | Sigma |
| A | 7 | 110 | 4001 | 8.78 | 1271 | 1191 | 320.2 |
| A | 0 | 29 | 3929 | 8.55 | 1271 | 1191 | 320.2 |
| A | 9 | 19 | 3866 | 8.35 | 1271 | 1191 | 320.2 |
| B | 2 | 9 | 4112 | 12.32 | 1237 | 1180 | 238.0 |
| B | 3 | 80 | 3294 | 8.88 | 1237 | 1180 | 238.0 |
| B | 2 | 8 | 3262 | 8.75 | 1237 | 1180 | 238.0 |
| C | 1 | 81 | 3920 | 8.38 | 1263 | 1179 | 327.2 |
| C | 3 | 202 | 3814 | 8.05 | 1263 | 1179 | 327.2 |
| C | 1 | 80 | 3693 | 7.68 | 1263 | 1179 | 327.2 |
| D | 7 | 3 | 3114 | 6.58 | 1166 | 1058 | 312.6 |
| D | 10 | 189 | 3034 | 6.32 | 1166 | 1058 | 312.6 |
| D | 4 | 160 | 2942 | 6.02 | 1166 | 1058 | 312.6 |
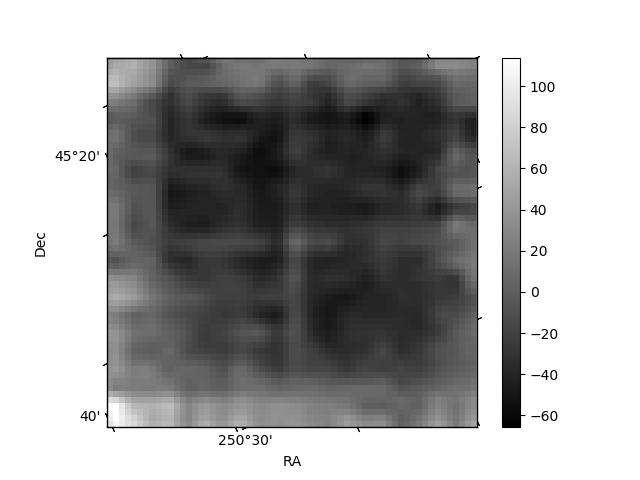
Histogram calculated using DETX and DETY for each event in the final _common_clean file
| Quadrant A |  |
 |
Quadrant B |
|---|---|---|---|
| Quadrant D |  |
 |
Quadrant C |
| Plot type | Count rate plots | Images |
|---|---|---|
| Comparison with Poisson distribution Blue bars denote a histogram of data divided into 1 sec bins. Red curve is a Poisson curve with rate = median count rate of data. |
 |
 |
| Quadrant-wise count rates Data is divided into 100 sec bins |
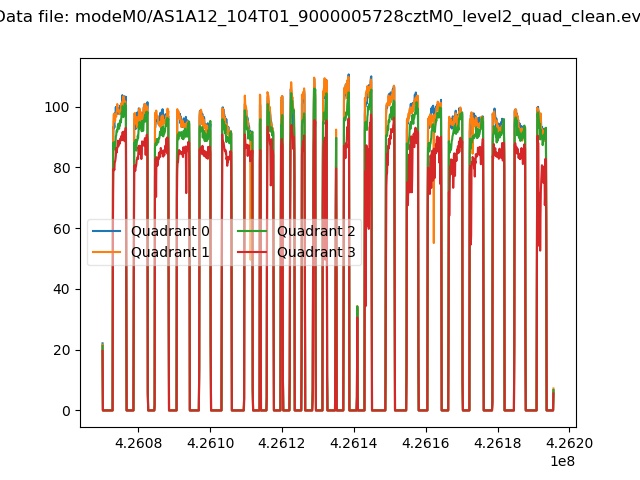 |
|
| Module-wise count rates for Quadrant A Data is divided into 100 sec bins |
 |
 |
| Module-wise count rates for Quadrant B Data is divided into 100 sec bins |
 |
 |
| Module-wise count rates for Quadrant C Data is divided into 100 sec bins |
 |
 |
| Module-wise count rates for Quadrant D Data is divided into 100 sec bins |
 |
 |
| Parameter | Plot |
|---|---|
| CZT HV Monitor |  |
| D_VDD |  |
| Temperature 1 |  |
| Veto HV Monitor |  |
| Veto LLD |  |
| Alpha Counter |  |
| _CPM_Rate |  |
| CZT Counter |  |
| +2.5 Volts monitor |  |
| +5 Volts monitor |  |
| _ROLL_ROT |  |
| _Roll_DEC |  |
| _Roll_RA |  |
| Veto Counter |  |