| Param | Original file | Final file |
|---|---|---|
| Filename | modeM0/AS1A12_025T16_9000005724cztM0_level2.fits | modeM0/AS1A12_025T16_9000005724cztM0_level2_quad_clean.evt |
| Size (bytes) | 143,467,200 | 125,300,160 |
| Size | 136.8 MB | 119.5 MB |
| Events in quadrant A | 850,406 | 705,768 |
| Events in quadrant B | 816,792 | 702,050 |
| Events in quadrant C | 840,716 | 673,460 |
| Events in quadrant D | 705,172 | 580,897 |
| Mode M0 | |||
|---|---|---|---|
| Quadrant | BADHDUFLAG | Total packets | Discarded packets |
| A | 0 | 35790 | 0 |
| B | 0 | 34727 | 0 |
| C | 0 | 33138 | 0 |
| D | 0 | 43671 | 0 |
| Mode M9 | |||
|---|---|---|---|
| Quadrant | BADHDUFLAG | Total packets | Discarded packets |
| A | 0 | 53 | 0 |
| B | 0 | 53 | 0 |
| C | 0 | 53 | 0 |
| D | 0 | 53 | 0 |
| Mode SS | |||
|---|---|---|---|
| Quadrant | BADHDUFLAG | Total packets | Discarded packets |
| A | 0 | 338 | 0 |
| B | 0 | 338 | 0 |
| C | 0 | 338 | 0 |
| D | 0 | 338 | 0 |
| Quadrant | Total seconds | Saturated seconds | Saturation percentage |
|---|---|---|---|
| A | 16401 | 52 | 0.317054% |
| B | 16397 | 123 | 0.750137% |
| C | 16400 | 10 | 0.060976% |
| D | 16402 | 818 | 4.987197% |
Noise dominated data is calculated using 1-second bins in cleaned event files. If a bin has >2000 counts, and if more than 50% of those come from <1% of pixels, then it is considered to be noise-dominated and hence unusable.
| Quadrant | # 1 sec bins | Bins with >0 counts | Bins with >2000 counts | High rate bins dominated by noise | Noise dominated (total time) | Noise dominated (detector-on time) | Marked lightcurve |
|---|---|---|---|---|---|---|---|
| A | 21807 | 16403 | 0 | 0 | 0.00% | 0.00% |  |
| B | 21807 | 16402 | 0 | 0 | 0.00% | 0.00% |  |
| C | 21807 | 16402 | 0 | 0 | 0.00% | 0.00% |  |
| D | 21807 | 16382 | 0 | 0 | 0.00% | 0.00% |  |
Top three noisy pixels from each quadrant. If the there are fewer than three noisy pixels in the level2.evt file, extra rows are filled as -1
| Pixel properties | Quadrant properties | ||||||
|---|---|---|---|---|---|---|---|
| Quadrant | DetID | PixID | Counts | Sigma | Mean | Median | Sigma |
| A | 0 | 29 | 730 | 8.85 | 222 | 207 | 59.1 |
| A | 9 | 19 | 718 | 8.65 | 222 | 207 | 59.1 |
| A | 7 | 110 | 688 | 8.14 | 222 | 207 | 59.1 |
| B | 2 | 9 | 719 | 11.42 | 216 | 205 | 45.0 |
| B | 5 | 128 | 597 | 8.71 | 216 | 205 | 45.0 |
| B | 2 | 8 | 593 | 8.62 | 216 | 205 | 45.0 |
| C | 1 | 81 | 681 | 8.09 | 221 | 206 | 58.7 |
| C | 1 | 80 | 661 | 7.75 | 221 | 206 | 58.7 |
| C | 3 | 203 | 658 | 7.7 | 221 | 206 | 58.7 |
| D | 7 | 3 | 562 | 6.82 | 201 | 183 | 55.6 |
| D | 4 | 160 | 529 | 6.23 | 201 | 183 | 55.6 |
| D | 3 | 14 | 516 | 5.99 | 201 | 183 | 55.6 |
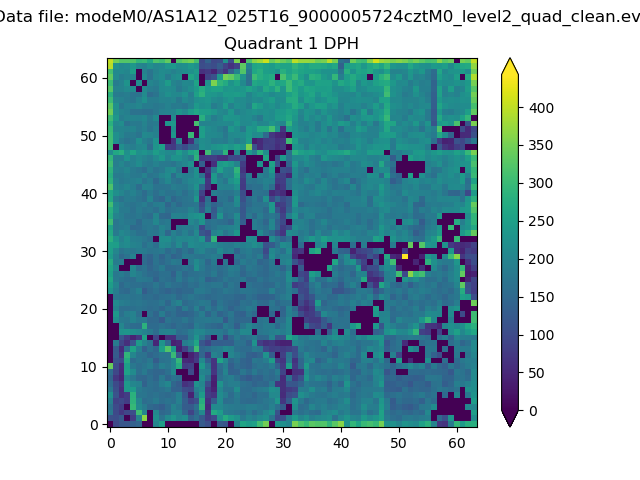
Histogram calculated using DETX and DETY for each event in the final _common_clean file
| Quadrant A |  |
 |
Quadrant B |
|---|---|---|---|
| Quadrant D | 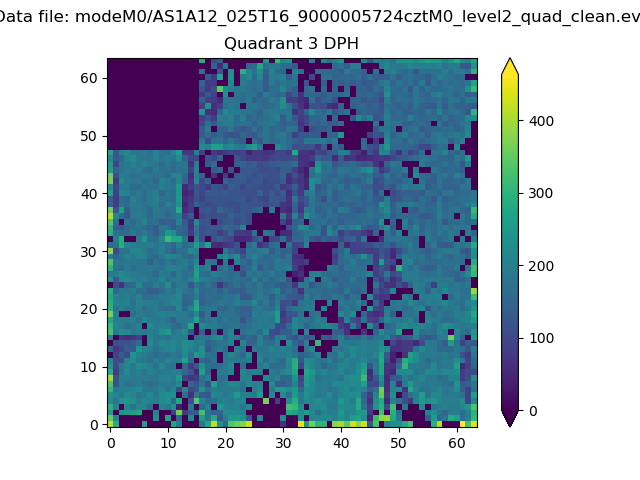 |
 |
Quadrant C |
| Plot type | Count rate plots | Images |
|---|---|---|
| Comparison with Poisson distribution Blue bars denote a histogram of data divided into 1 sec bins. Red curve is a Poisson curve with rate = median count rate of data. |
 |
 |
| Quadrant-wise count rates Data is divided into 100 sec bins |
 |
|
| Module-wise count rates for Quadrant A Data is divided into 100 sec bins |
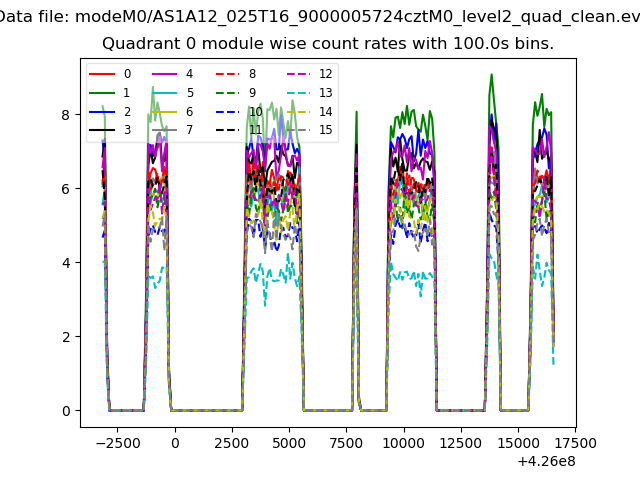 |
 |
| Module-wise count rates for Quadrant B Data is divided into 100 sec bins |
 |
 |
| Module-wise count rates for Quadrant C Data is divided into 100 sec bins |
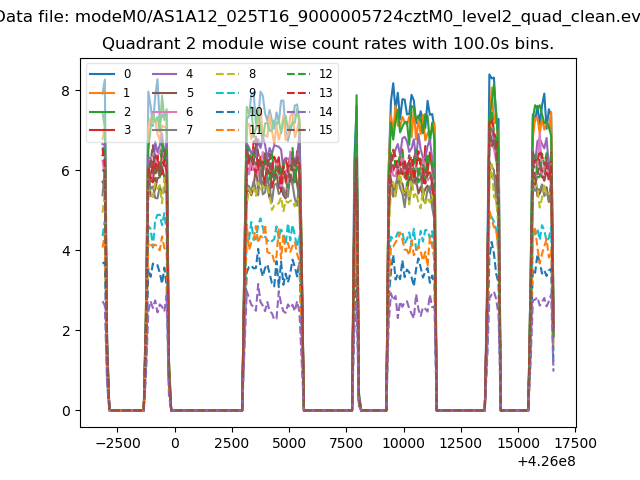 |
 |
| Module-wise count rates for Quadrant D Data is divided into 100 sec bins |
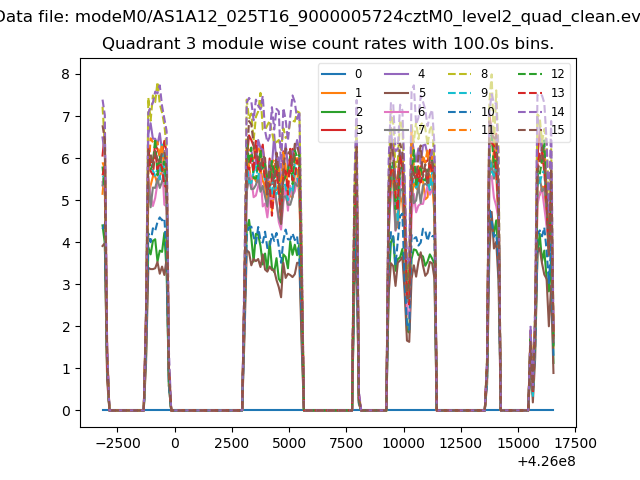 |
 |
| Parameter | Plot |
|---|---|
| CZT HV Monitor |  |
| D_VDD |  |
| Temperature 1 |  |
| Veto HV Monitor |  |
| Veto LLD | 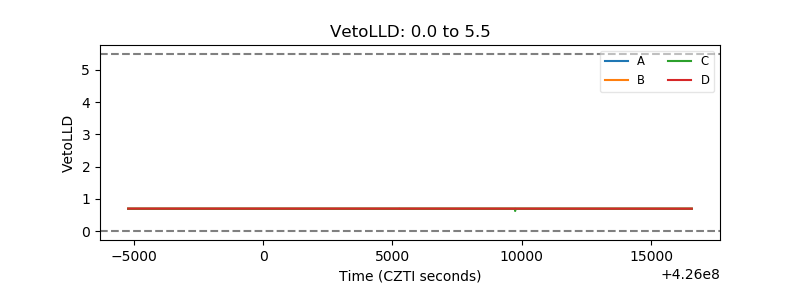 |
| Alpha Counter | 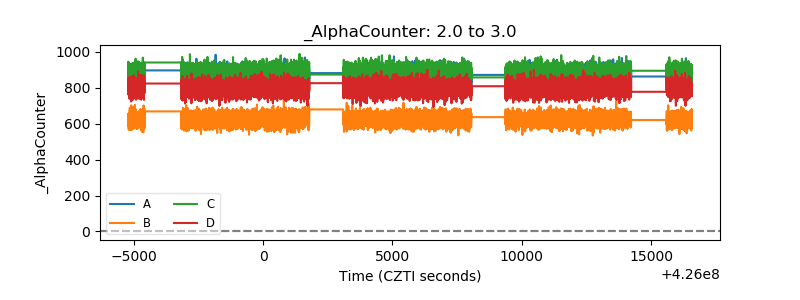 |
| _CPM_Rate | 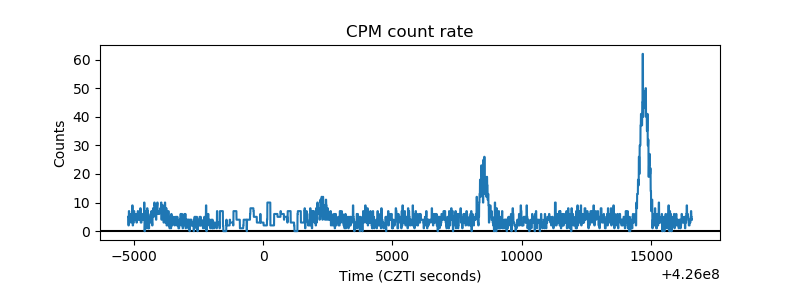 |
| CZT Counter |  |
| +2.5 Volts monitor |  |
| +5 Volts monitor | 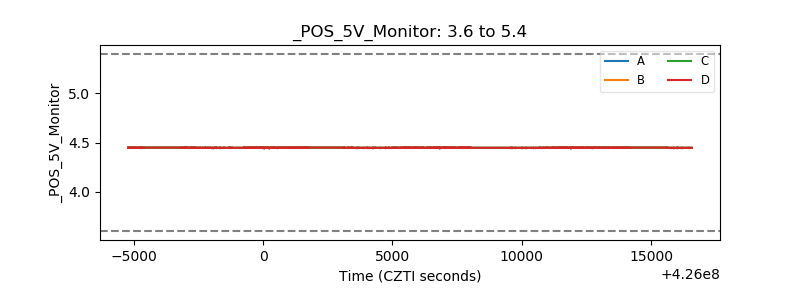 |
| _ROLL_ROT |  |
| _Roll_DEC |  |
| _Roll_RA |  |
| Veto Counter |  |