| Param | Original file | Final file |
|---|---|---|
| Filename | modeM0/AS1A12_101T01_9000005722cztM0_level2.fits | modeM0/AS1A12_101T01_9000005722cztM0_level2_quad_clean.evt |
| Size (bytes) | 307,460,160 | 315,273,600 |
| Size | 293.2 MB | 300.7 MB |
| Events in quadrant A | 1,858,896 | 1,914,004 |
| Events in quadrant B | 1,782,502 | 1,903,306 |
| Events in quadrant C | 1,819,008 | 1,803,697 |
| Events in quadrant D | 1,546,596 | 1,622,273 |
| Mode M0 | |||
|---|---|---|---|
| Quadrant | BADHDUFLAG | Total packets | Discarded packets |
| A | 0 | 71813 | 0 |
| B | 0 | 72931 | 0 |
| C | 0 | 67653 | 0 |
| D | 0 | 84817 | 0 |
| Mode M9 | |||
|---|---|---|---|
| Quadrant | BADHDUFLAG | Total packets | Discarded packets |
| A | 0 | 154 | 0 |
| B | 0 | 154 | 0 |
| C | 0 | 154 | 0 |
| D | 0 | 154 | 0 |
| Mode SS | |||
|---|---|---|---|
| Quadrant | BADHDUFLAG | Total packets | Discarded packets |
| A | 0 | 684 | 0 |
| B | 0 | 684 | 0 |
| C | 0 | 684 | 0 |
| D | 0 | 684 | 0 |
| Quadrant | Total seconds | Saturated seconds | Saturation percentage |
|---|---|---|---|
| A | 33545 | 92 | 0.274258% |
| B | 33545 | 431 | 1.284841% |
| C | 33545 | 18 | 0.053659% |
| D | 33545 | 1030 | 3.070502% |
Noise dominated data is calculated using 1-second bins in cleaned event files. If a bin has >2000 counts, and if more than 50% of those come from <1% of pixels, then it is considered to be noise-dominated and hence unusable.
| Quadrant | # 1 sec bins | Bins with >0 counts | Bins with >2000 counts | High rate bins dominated by noise | Noise dominated (total time) | Noise dominated (detector-on time) | Marked lightcurve |
|---|---|---|---|---|---|---|---|
| A | 47322 | 33544 | 0 | 0 | 0.00% | 0.00% |  |
| B | 47322 | 33542 | 0 | 0 | 0.00% | 0.00% |  |
| C | 47322 | 33544 | 0 | 0 | 0.00% | 0.00% |  |
| D | 47322 | 33536 | 0 | 0 | 0.00% | 0.00% |  |
Top three noisy pixels from each quadrant. If the there are fewer than three noisy pixels in the level2.evt file, extra rows are filled as -1
| Pixel properties | Quadrant properties | ||||||
|---|---|---|---|---|---|---|---|
| Quadrant | DetID | PixID | Counts | Sigma | Mean | Median | Sigma |
| A | 7 | 110 | 1556 | 9.03 | 484 | 457 | 121.7 |
| A | 9 | 19 | 1492 | 8.5 | 484 | 457 | 121.7 |
| A | 0 | 29 | 1488 | 8.47 | 484 | 457 | 121.7 |
| B | 2 | 9 | 1516 | 11.65 | 470 | 450 | 91.5 |
| B | 3 | 80 | 1290 | 9.18 | 470 | 450 | 91.5 |
| B | 3 | 17 | 1254 | 8.78 | 470 | 450 | 91.5 |
| C | 1 | 81 | 1467 | 8.16 | 479 | 450 | 124.6 |
| C | 3 | 202 | 1433 | 7.89 | 479 | 450 | 124.6 |
| C | 3 | 203 | 1419 | 7.78 | 479 | 450 | 124.6 |
| D | 7 | 3 | 1202 | 6.72 | 442 | 404 | 118.7 |
| D | 10 | 189 | 1139 | 6.19 | 442 | 404 | 118.7 |
| D | 15 | 46 | 1125 | 6.07 | 442 | 404 | 118.7 |
Histogram calculated using DETX and DETY for each event in the final _common_clean file
| Quadrant A |  |
 |
Quadrant B |
|---|---|---|---|
| Quadrant D |  |
 |
Quadrant C |
| Plot type | Count rate plots | Images |
|---|---|---|
| Comparison with Poisson distribution Blue bars denote a histogram of data divided into 1 sec bins. Red curve is a Poisson curve with rate = median count rate of data. |
 |
 |
| Quadrant-wise count rates Data is divided into 100 sec bins |
 |
|
| Module-wise count rates for Quadrant A Data is divided into 100 sec bins |
 |
 |
| Module-wise count rates for Quadrant B Data is divided into 100 sec bins |
 |
 |
| Module-wise count rates for Quadrant C Data is divided into 100 sec bins |
 |
 |
| Module-wise count rates for Quadrant D Data is divided into 100 sec bins |
 |
 |
| Parameter | Plot |
|---|---|
| CZT HV Monitor | 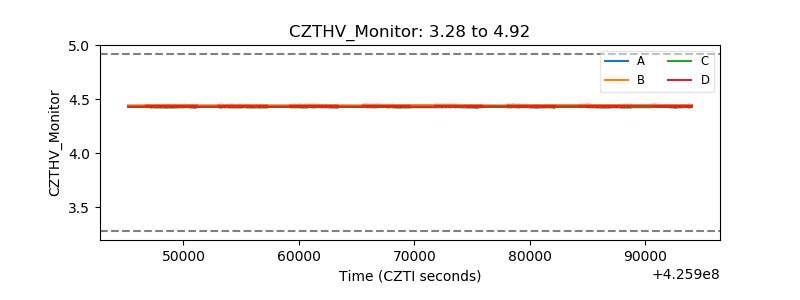 |
| D_VDD |  |
| Temperature 1 |  |
| Veto HV Monitor |  |
| Veto LLD |  |
| Alpha Counter | 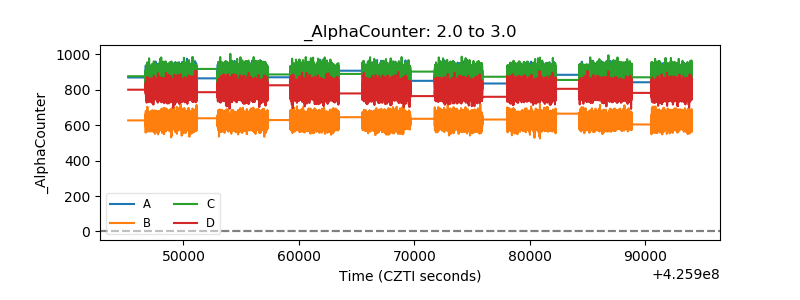 |
| _CPM_Rate | 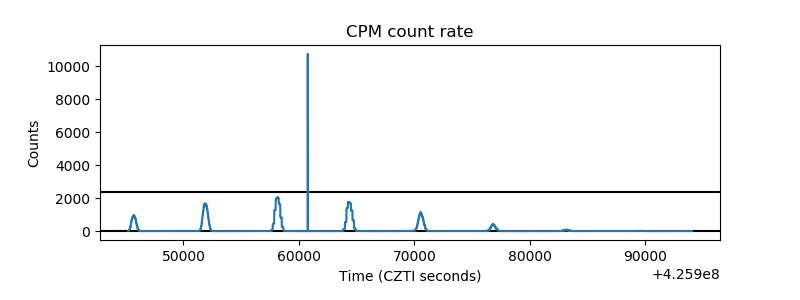 |
| CZT Counter | 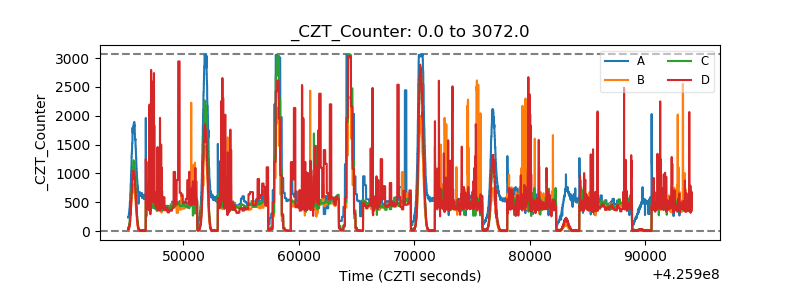 |
| +2.5 Volts monitor |  |
| +5 Volts monitor |  |
| _ROLL_ROT |  |
| _Roll_DEC |  |
| _Roll_RA |  |
| Veto Counter |  |