| Param | Original file | Final file |
|---|---|---|
| Filename | modeM0/AS1A12_099T03_9000005720cztM0_level2.fits | modeM0/AS1A12_099T03_9000005720cztM0_level2_quad_clean.evt |
| Size (bytes) | 772,223,040 | 818,507,520 |
| Size | 736.4 MB | 780.6 MB |
| Events in quadrant A | 4,648,640 | 4,991,945 |
| Events in quadrant B | 4,638,642 | 5,329,275 |
| Events in quadrant C | 4,697,226 | 5,118,721 |
| Events in quadrant D | 3,030,516 | 3,000,230 |
| Mode M0 | |||
|---|---|---|---|
| Quadrant | BADHDUFLAG | Total packets | Discarded packets |
| A | 0 | 259257 | 0 |
| B | 0 | 216086 | 0 |
| C | 0 | 219923 | 0 |
| D | 0 | 486183 | 0 |
| Mode SS | |||
|---|---|---|---|
| Quadrant | BADHDUFLAG | Total packets | Discarded packets |
| A | 0 | 1888 | 0 |
| B | 0 | 1888 | 0 |
| C | 0 | 1888 | 0 |
| D | 0 | 1888 | 0 |
| Mode M9 | |||
|---|---|---|---|
| Quadrant | BADHDUFLAG | Total packets | Discarded packets |
| A | 0 | 322 | 0 |
| B | 0 | 323 | 0 |
| C | 0 | 323 | 0 |
| D | 0 | 323 | 0 |
| Quadrant | Total seconds | Saturated seconds | Saturation percentage |
|---|---|---|---|
| A | 92641 | 7169 | 7.738474% |
| B | 92641 | 2699 | 2.913397% |
| C | 92565 | 3142 | 3.394372% |
| D | 92579 | 38734 | 41.838862% |
Noise dominated data is calculated using 1-second bins in cleaned event files. If a bin has >2000 counts, and if more than 50% of those come from <1% of pixels, then it is considered to be noise-dominated and hence unusable.
| Quadrant | # 1 sec bins | Bins with >0 counts | Bins with >2000 counts | High rate bins dominated by noise | Noise dominated (total time) | Noise dominated (detector-on time) | Marked lightcurve |
|---|---|---|---|---|---|---|---|
| A | 128550 | 91776 | 0 | 0 | 0.00% | 0.00% |  |
| B | 128550 | 92605 | 0 | 0 | 0.00% | 0.00% |  |
| C | 128545 | 92359 | 0 | 0 | 0.00% | 0.00% |  |
| D | 128550 | 91138 | 0 | 0 | 0.00% | 0.00% |  |
Top three noisy pixels from each quadrant. If the there are fewer than three noisy pixels in the level2.evt file, extra rows are filled as -1
| Pixel properties | Quadrant properties | ||||||
|---|---|---|---|---|---|---|---|
| Quadrant | DetID | PixID | Counts | Sigma | Mean | Median | Sigma |
| A | 0 | 29 | 3852 | 8.96 | 1212 | 1133 | 303.4 |
| A | 7 | 110 | 3844 | 8.93 | 1212 | 1133 | 303.4 |
| A | 9 | 19 | 3659 | 8.33 | 1212 | 1133 | 303.4 |
| B | 2 | 9 | 3980 | 11.67 | 1224 | 1165 | 241.2 |
| B | 3 | 80 | 3408 | 9.3 | 1224 | 1165 | 241.2 |
| B | 2 | 8 | 3196 | 8.42 | 1224 | 1165 | 241.2 |
| C | 1 | 81 | 3916 | 8.71 | 1240 | 1162 | 316.4 |
| C | 1 | 80 | 3687 | 7.98 | 1240 | 1162 | 316.4 |
| C | 3 | 203 | 3619 | 7.77 | 1240 | 1162 | 316.4 |
| D | 7 | 3 | 2237 | 6.2 | 867 | 790 | 233.1 |
| D | 6 | 62 | 2140 | 5.79 | 867 | 790 | 233.1 |
| D | 10 | 189 | 2135 | 5.77 | 867 | 790 | 233.1 |
Histogram calculated using DETX and DETY for each event in the final _common_clean file
| Quadrant A | 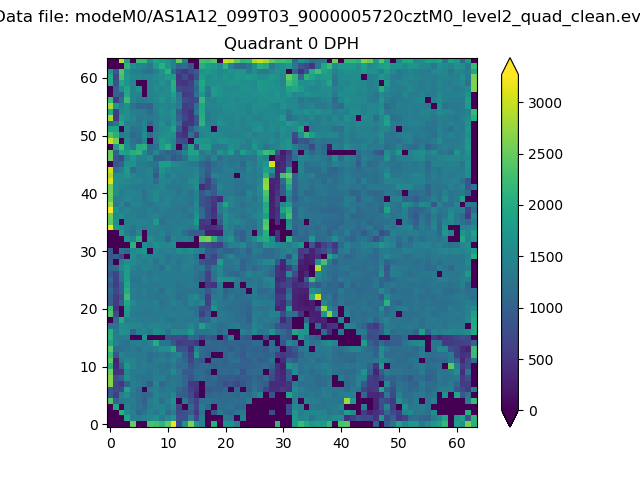 |
 |
Quadrant B |
|---|---|---|---|
| Quadrant D |  |
 |
Quadrant C |
| Plot type | Count rate plots | Images |
|---|---|---|
| Comparison with Poisson distribution Blue bars denote a histogram of data divided into 1 sec bins. Red curve is a Poisson curve with rate = median count rate of data. |
 |
 |
| Quadrant-wise count rates Data is divided into 100 sec bins |
 |
|
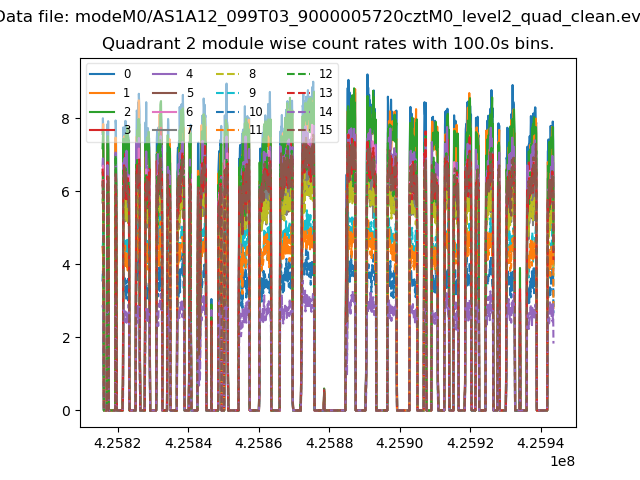
| Module-wise count rates for Quadrant A Data is divided into 100 sec bins |
 |
 |
| Module-wise count rates for Quadrant B Data is divided into 100 sec bins |
 |
 |
| Module-wise count rates for Quadrant C Data is divided into 100 sec bins |
 |
 |
| Module-wise count rates for Quadrant D Data is divided into 100 sec bins |
 |
 |
| Parameter | Plot |
|---|---|
| CZT HV Monitor |  |
| D_VDD | 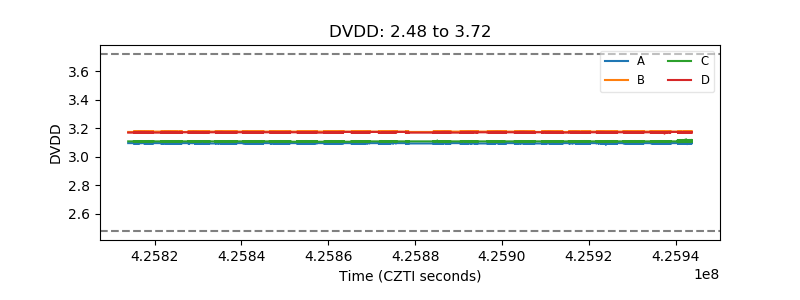 |
| Temperature 1 |  |
| Veto HV Monitor | 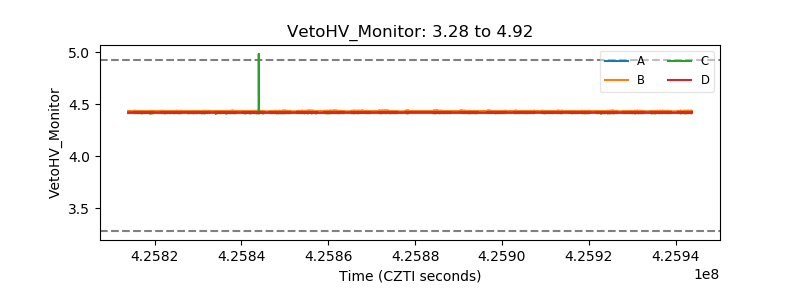 |
| Veto LLD | 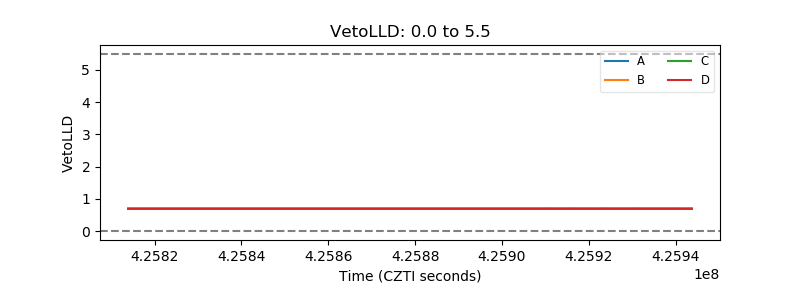 |
| Alpha Counter |  |
| _CPM_Rate |  |
| CZT Counter |  |
| +2.5 Volts monitor |  |
| +5 Volts monitor | 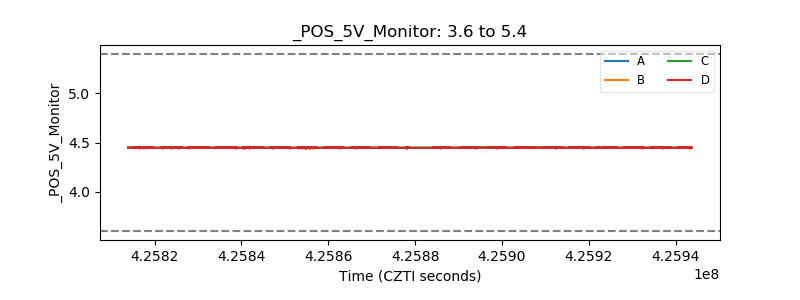 |
| _ROLL_ROT |  |
| _Roll_DEC | 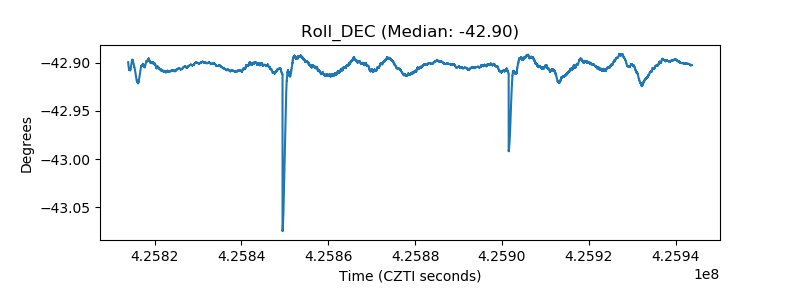 |
| _Roll_RA |  |
| Veto Counter | 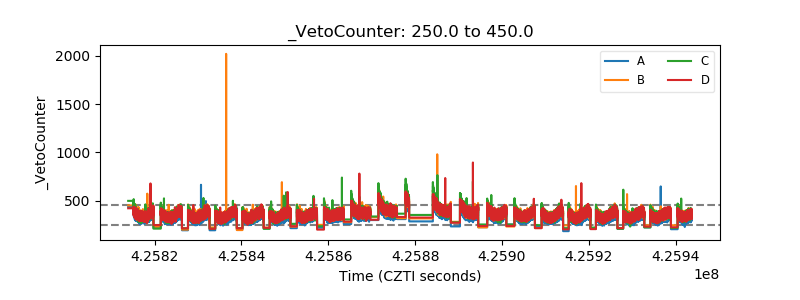 |