| Param | Original file | Final file |
|---|---|---|
| Filename | modeM0/AS1T05_118T01_9000005718cztM0_level2.fits | modeM0/AS1T05_118T01_9000005718cztM0_level2_quad_clean.evt |
| Size (bytes) | 399,176,640 | 406,033,920 |
| Size | 380.7 MB | 387.2 MB |
| Events in quadrant A | 2,645,984 | 2,769,567 |
| Events in quadrant B | 2,574,746 | 2,928,930 |
| Events in quadrant C | 2,614,982 | 2,794,779 |
| Events in quadrant D | 736,642 | 309,586 |
| Mode SS | |||
|---|---|---|---|
| Quadrant | BADHDUFLAG | Total packets | Discarded packets |
| A | 0 | 1046 | 0 |
| B | 0 | 1046 | 0 |
| C | 0 | 1046 | 0 |
| D | 0 | 1046 | 0 |
| Mode M9 | |||
|---|---|---|---|
| Quadrant | BADHDUFLAG | Total packets | Discarded packets |
| A | 0 | 184 | 0 |
| B | 0 | 184 | 0 |
| C | 0 | 184 | 0 |
| D | 0 | 184 | 0 |
| Mode M0 | |||
|---|---|---|---|
| Quadrant | BADHDUFLAG | Total packets | Discarded packets |
| A | 0 | 143070 | 0 |
| B | 0 | 123071 | 0 |
| C | 0 | 114613 | 0 |
| D | 0 | 418586 | 0 |
| Quadrant | Total seconds | Saturated seconds | Saturation percentage |
|---|---|---|---|
| A | 50871 | 3075 | 6.044701% |
| B | 50871 | 1289 | 2.533860% |
| C | 50871 | 1438 | 2.826758% |
| D | 50871 | 45380 | 89.206031% |
Noise dominated data is calculated using 1-second bins in cleaned event files. If a bin has >2000 counts, and if more than 50% of those come from <1% of pixels, then it is considered to be noise-dominated and hence unusable.
| Quadrant | # 1 sec bins | Bins with >0 counts | Bins with >2000 counts | High rate bins dominated by noise | Noise dominated (total time) | Noise dominated (detector-on time) | Marked lightcurve |
|---|---|---|---|---|---|---|---|
| A | 69511 | 50834 | 0 | 0 | 0.00% | 0.00% |  |
| B | 69511 | 50858 | 0 | 0 | 0.00% | 0.00% |  |
| C | 69511 | 50726 | 0 | 0 | 0.00% | 0.00% |  |
| D | 69510 | 46130 | 0 | 0 | 0.00% | 0.00% |  |
Top three noisy pixels from each quadrant. If the there are fewer than three noisy pixels in the level2.evt file, extra rows are filled as -1
| Pixel properties | Quadrant properties | ||||||
|---|---|---|---|---|---|---|---|
| Quadrant | DetID | PixID | Counts | Sigma | Mean | Median | Sigma |
| A | 7 | 110 | 2270 | 9.52 | 689 | 648 | 170.3 |
| A | 0 | 29 | 2266 | 9.5 | 689 | 648 | 170.3 |
| A | 9 | 19 | 2264 | 9.49 | 689 | 648 | 170.3 |
| B | 2 | 9 | 2312 | 12.41 | 683 | 652 | 133.8 |
| B | 2 | 8 | 1953 | 9.72 | 683 | 652 | 133.8 |
| B | 3 | 80 | 1895 | 9.29 | 683 | 652 | 133.8 |
| C | 1 | 81 | 2170 | 8.52 | 689 | 643 | 179.1 |
| C | 3 | 203 | 2093 | 8.09 | 689 | 643 | 179.1 |
| C | 1 | 80 | 2048 | 7.84 | 689 | 643 | 179.1 |
| D | 7 | 3 | 567 | 6.38 | 211 | 191 | 59.0 |
| D | 4 | 160 | 565 | 6.34 | 211 | 191 | 59.0 |
| D | 1 | 3 | 542 | 5.95 | 211 | 191 | 59.0 |
Histogram calculated using DETX and DETY for each event in the final _common_clean file
| Quadrant A |  |
 |
Quadrant B |
|---|---|---|---|
| Quadrant D |  |
 |
Quadrant C |
| Plot type | Count rate plots | Images |
|---|---|---|
| Comparison with Poisson distribution Blue bars denote a histogram of data divided into 1 sec bins. Red curve is a Poisson curve with rate = median count rate of data. |
 |
 |
| Quadrant-wise count rates Data is divided into 100 sec bins |
 |
|
| Module-wise count rates for Quadrant A Data is divided into 100 sec bins |
 |
 |
| Module-wise count rates for Quadrant B Data is divided into 100 sec bins |
 |
 |
| Module-wise count rates for Quadrant C Data is divided into 100 sec bins |
 |
 |
| Module-wise count rates for Quadrant D Data is divided into 100 sec bins |
 |
 |
| Parameter | Plot |
|---|---|
| CZT HV Monitor |  |
| D_VDD |  |
| Temperature 1 |  |
| Veto HV Monitor |  |
| Veto LLD |  |
| Alpha Counter |  |
| _CPM_Rate |  |
| CZT Counter |  |
| +2.5 Volts monitor |  |
| +5 Volts monitor |  |
| _ROLL_ROT |  |
| _Roll_DEC | 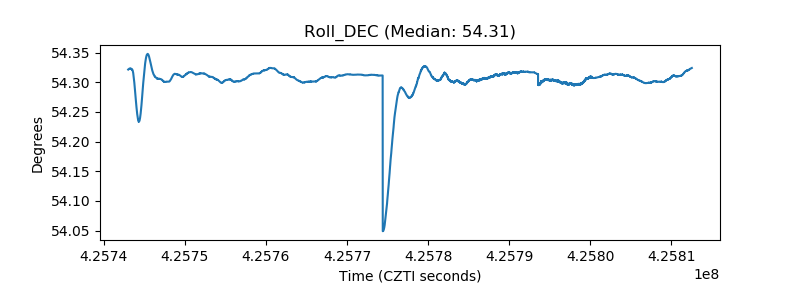 |
| _Roll_RA |  |
| Veto Counter |  |