| Param | Original file | Final file |
|---|---|---|
| Filename | modeM0/AS1A12_099T01_9000005716cztM0_level2.fits | modeM0/AS1A12_099T01_9000005716cztM0_level2_quad_clean.evt |
| Size (bytes) | 862,600,320 | 866,321,280 |
| Size | 822.6 MB | 826.2 MB |
| Events in quadrant A | 5,305,770 | 5,281,732 |
| Events in quadrant B | 5,198,830 | 5,495,234 |
| Events in quadrant C | 5,245,890 | 5,266,681 |
| Events in quadrant D | 3,503,606 | 3,339,899 |
| Mode M9 | |||
|---|---|---|---|
| Quadrant | BADHDUFLAG | Total packets | Discarded packets |
| A | 0 | 394 | 0 |
| B | 0 | 394 | 0 |
| C | 0 | 395 | 0 |
| D | 0 | 395 | 0 |
| Mode M0 | |||
|---|---|---|---|
| Quadrant | BADHDUFLAG | Total packets | Discarded packets |
| A | 0 | 275273 | 0 |
| B | 0 | 220946 | 0 |
| C | 0 | 226622 | 0 |
| D | 0 | 438736 | 0 |
| Mode SS | |||
|---|---|---|---|
| Quadrant | BADHDUFLAG | Total packets | Discarded packets |
| A | 0 | 2042 | 0 |
| B | 0 | 2042 | 0 |
| C | 0 | 2042 | 0 |
| D | 0 | 2042 | 0 |
| Quadrant | Total seconds | Saturated seconds | Saturation percentage |
|---|---|---|---|
| A | 99983 | 4103 | 4.103698% |
| B | 99983 | 1500 | 1.500255% |
| C | 99983 | 3231 | 3.231549% |
| D | 99983 | 29415 | 29.420001% |
Noise dominated data is calculated using 1-second bins in cleaned event files. If a bin has >2000 counts, and if more than 50% of those come from <1% of pixels, then it is considered to be noise-dominated and hence unusable.
| Quadrant | # 1 sec bins | Bins with >0 counts | Bins with >2000 counts | High rate bins dominated by noise | Noise dominated (total time) | Noise dominated (detector-on time) | Marked lightcurve |
|---|---|---|---|---|---|---|---|
| A | 144208 | 99934 | 0 | 0 | 0.00% | 0.00% |  |
| B | 144208 | 99980 | 0 | 0 | 0.00% | 0.00% |  |
| C | 144208 | 99780 | 0 | 0 | 0.00% | 0.00% |  |
| D | 144208 | 95570 | 0 | 0 | 0.00% | 0.00% | 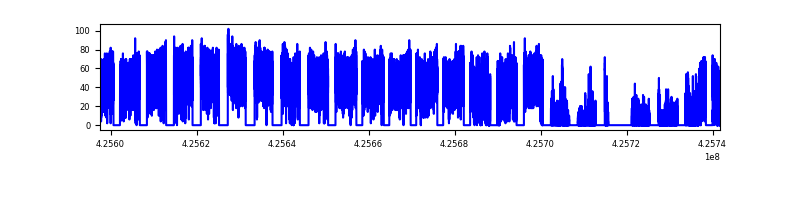 |
Top three noisy pixels from each quadrant. If the there are fewer than three noisy pixels in the level2.evt file, extra rows are filled as -1
| Pixel properties | Quadrant properties | ||||||
|---|---|---|---|---|---|---|---|
| Quadrant | DetID | PixID | Counts | Sigma | Mean | Median | Sigma |
| A | 7 | 110 | 4391 | 8.93 | 1383 | 1296 | 346.4 |
| A | 9 | 19 | 4265 | 8.57 | 1383 | 1296 | 346.4 |
| A | 0 | 29 | 4236 | 8.49 | 1383 | 1296 | 346.4 |
| B | 2 | 9 | 4445 | 11.57 | 1374 | 1309 | 271.0 |
| B | 3 | 80 | 3678 | 8.74 | 1374 | 1309 | 271.0 |
| B | 2 | 8 | 3571 | 8.35 | 1374 | 1309 | 271.0 |
| C | 1 | 81 | 4252 | 8.25 | 1383 | 1296 | 358.3 |
| C | 1 | 80 | 4158 | 7.99 | 1383 | 1296 | 358.3 |
| C | 3 | 202 | 4093 | 7.81 | 1383 | 1296 | 358.3 |
| D | 7 | 3 | 2594 | 6.24 | 1004 | 914 | 269.3 |
| D | 10 | 189 | 2559 | 6.11 | 1004 | 914 | 269.3 |
| D | 10 | 113 | 2506 | 5.91 | 1004 | 914 | 269.3 |
Histogram calculated using DETX and DETY for each event in the final _common_clean file
| Quadrant A | 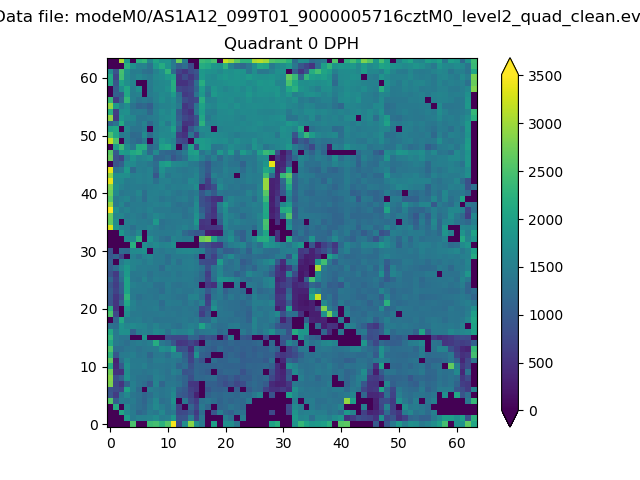 |
 |
Quadrant B |
|---|---|---|---|
| Quadrant D |  |
 |
Quadrant C |
| Plot type | Count rate plots | Images |
|---|---|---|
| Comparison with Poisson distribution Blue bars denote a histogram of data divided into 1 sec bins. Red curve is a Poisson curve with rate = median count rate of data. |
 |
 |
| Quadrant-wise count rates Data is divided into 100 sec bins |
 |
|
| Module-wise count rates for Quadrant A Data is divided into 100 sec bins |
 |
 |
| Module-wise count rates for Quadrant B Data is divided into 100 sec bins |
 |
 |
| Module-wise count rates for Quadrant C Data is divided into 100 sec bins |
 |
 |
| Module-wise count rates for Quadrant D Data is divided into 100 sec bins |
 |
 |
| Parameter | Plot |
|---|---|
| CZT HV Monitor |  |
| D_VDD |  |
| Temperature 1 |  |
| Veto HV Monitor |  |
| Veto LLD |  |
| Alpha Counter |  |
| _CPM_Rate |  |
| CZT Counter |  |
| +2.5 Volts monitor |  |
| +5 Volts monitor |  |
| _ROLL_ROT | 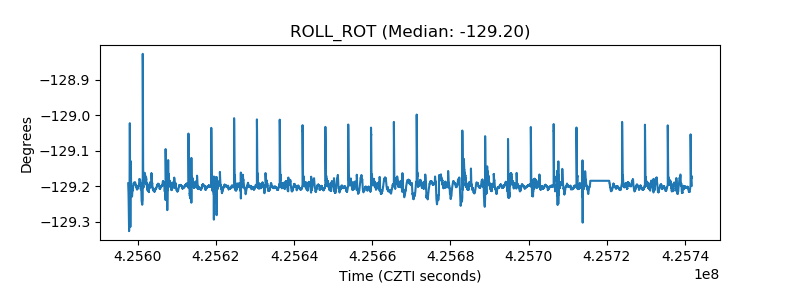 |
| _Roll_DEC |  |
| _Roll_RA |  |
| Veto Counter | 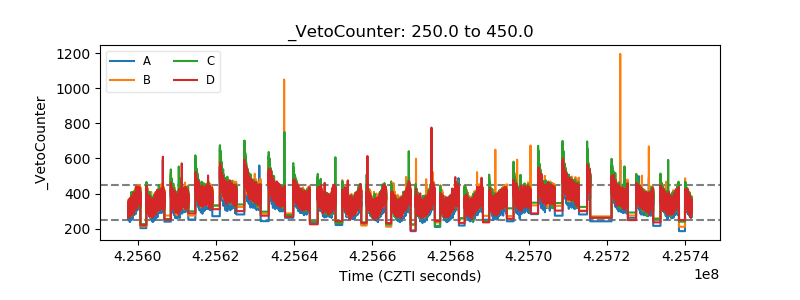 |