| Param | Original file | Final file |
|---|---|---|
| Filename | modeM0/AS1T05_124T01_9000005712cztM0_level2.fits | modeM0/AS1T05_124T01_9000005712cztM0_level2_quad_clean.evt |
| Size (bytes) | 564,503,040 | 572,215,680 |
| Size | 538.4 MB | 545.7 MB |
| Events in quadrant A | 3,332,502 | 3,374,286 |
| Events in quadrant B | 3,296,932 | 3,497,312 |
| Events in quadrant C | 3,265,454 | 3,219,287 |
| Events in quadrant D | 2,796,234 | 2,837,835 |
| Mode SS | |||
|---|---|---|---|
| Quadrant | BADHDUFLAG | Total packets | Discarded packets |
| A | 0 | 1306 | 0 |
| B | 0 | 1311 | 0 |
| C | 0 | 1314 | 0 |
| D | 0 | 1311 | 0 |
| Mode M9 | |||
|---|---|---|---|
| Quadrant | BADHDUFLAG | Total packets | Discarded packets |
| A | 0 | 241 | 0 |
| B | 0 | 241 | 0 |
| C | 0 | 241 | 0 |
| D | 0 | 240 | 0 |
| Mode M0 | |||
|---|---|---|---|
| Quadrant | BADHDUFLAG | Total packets | Discarded packets |
| A | 0 | 186307 | 0 |
| B | 0 | 132052 | 0 |
| C | 0 | 144493 | 0 |
| D | 0 | 205273 | 0 |
| Quadrant | Total seconds | Saturated seconds | Saturation percentage |
|---|---|---|---|
| A | 64163 | 3924 | 6.115674% |
| B | 64171 | 149 | 0.232192% |
| C | 64132 | 1901 | 2.964199% |
| D | 64166 | 5249 | 8.180345% |
Noise dominated data is calculated using 1-second bins in cleaned event files. If a bin has >2000 counts, and if more than 50% of those come from <1% of pixels, then it is considered to be noise-dominated and hence unusable.
| Quadrant | # 1 sec bins | Bins with >0 counts | Bins with >2000 counts | High rate bins dominated by noise | Noise dominated (total time) | Noise dominated (detector-on time) | Marked lightcurve |
|---|---|---|---|---|---|---|---|
| A | 88429 | 64261 | 0 | 0 | 0.00% | 0.00% |  |
| B | 88429 | 64276 | 0 | 0 | 0.00% | 0.00% |  |
| C | 88429 | 64028 | 0 | 0 | 0.00% | 0.00% | 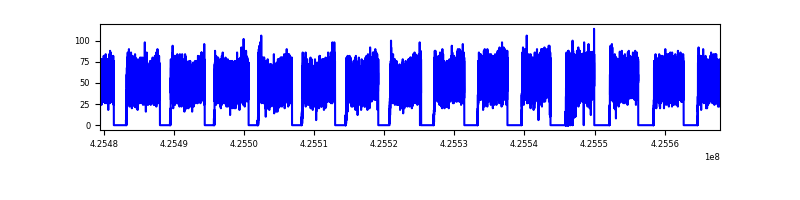 |
| D | 88429 | 64265 | 0 | 0 | 0.00% | 0.00% | 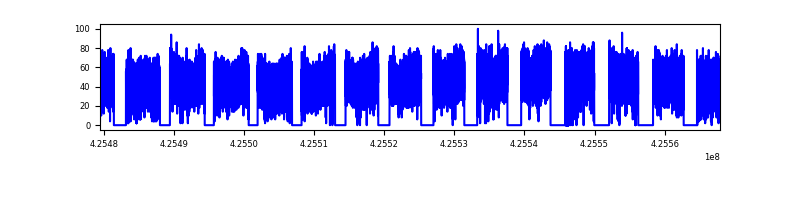 |
Top three noisy pixels from each quadrant. If the there are fewer than three noisy pixels in the level2.evt file, extra rows are filled as -1
| Pixel properties | Quadrant properties | ||||||
|---|---|---|---|---|---|---|---|
| Quadrant | DetID | PixID | Counts | Sigma | Mean | Median | Sigma |
| A | 9 | 19 | 2850 | 9.35 | 869 | 813 | 217.9 |
| A | 7 | 110 | 2846 | 9.33 | 869 | 813 | 217.9 |
| A | 0 | 29 | 2618 | 8.28 | 869 | 813 | 217.9 |
| B | 2 | 9 | 2832 | 11.62 | 871 | 829 | 172.3 |
| B | 3 | 80 | 2398 | 9.11 | 871 | 829 | 172.3 |
| B | 3 | 17 | 2326 | 8.69 | 871 | 829 | 172.3 |
| C | 1 | 81 | 2678 | 8.4 | 861 | 802 | 223.2 |
| C | 3 | 203 | 2511 | 7.66 | 861 | 802 | 223.2 |
| C | 3 | 202 | 2509 | 7.65 | 861 | 802 | 223.2 |
| D | 4 | 160 | 2123 | 6.55 | 800 | 729 | 212.6 |
| D | 10 | 189 | 2063 | 6.27 | 800 | 729 | 212.6 |
| D | 7 | 3 | 2016 | 6.05 | 800 | 729 | 212.6 |
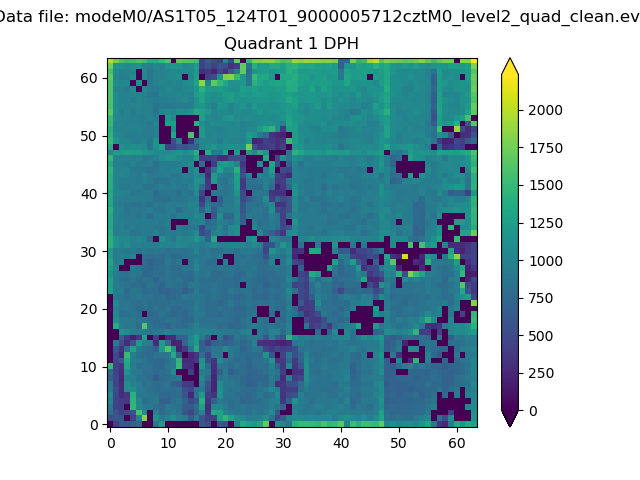
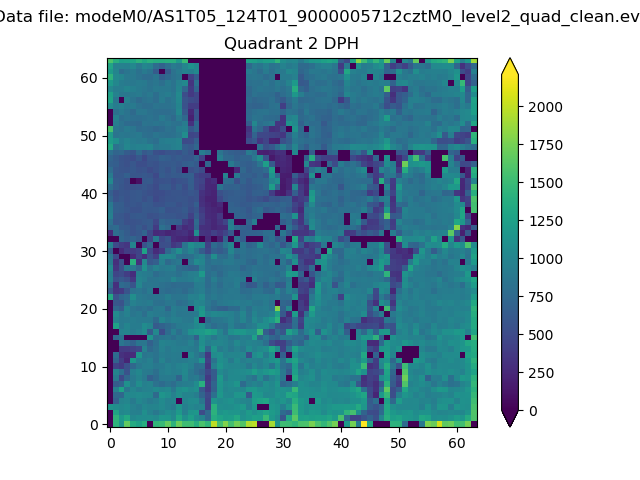
Histogram calculated using DETX and DETY for each event in the final _common_clean file
| Quadrant A |  |
 |
Quadrant B |
|---|---|---|---|
| Quadrant D |  |
 |
Quadrant C |
| Plot type | Count rate plots | Images |
|---|---|---|
| Comparison with Poisson distribution Blue bars denote a histogram of data divided into 1 sec bins. Red curve is a Poisson curve with rate = median count rate of data. |
 |
 |
| Quadrant-wise count rates Data is divided into 100 sec bins |
 |
|
| Module-wise count rates for Quadrant A Data is divided into 100 sec bins |
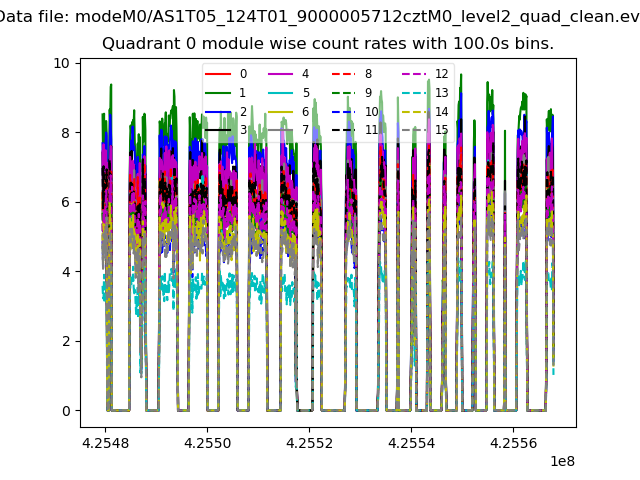 |
 |
| Module-wise count rates for Quadrant B Data is divided into 100 sec bins |
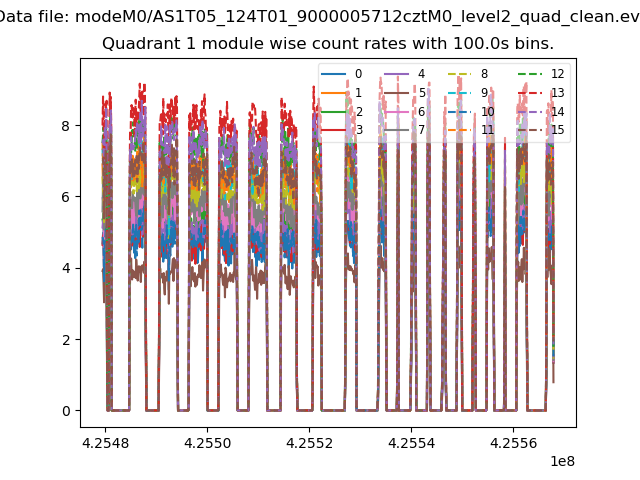 |
 |
| Module-wise count rates for Quadrant C Data is divided into 100 sec bins |
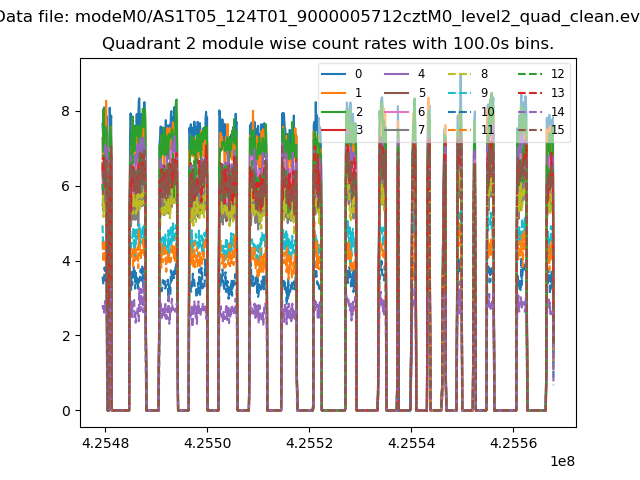 |
 |
| Module-wise count rates for Quadrant D Data is divided into 100 sec bins |
 |
 |
| Parameter | Plot |
|---|---|
| CZT HV Monitor |  |
| D_VDD |  |
| Temperature 1 | 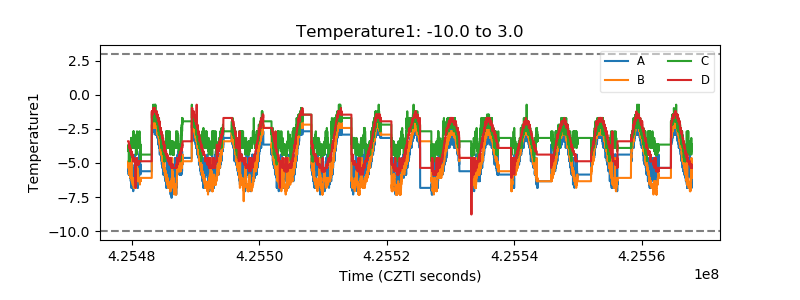 |
| Veto HV Monitor |  |
| Veto LLD | 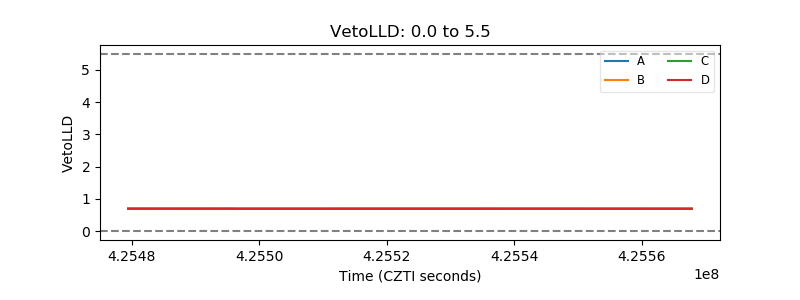 |
| Alpha Counter |  |
| _CPM_Rate | 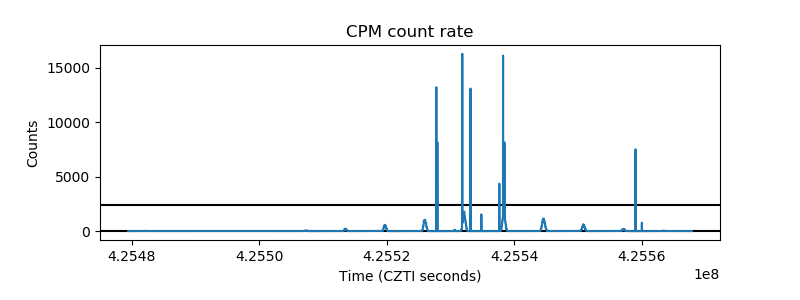 |
| CZT Counter |  |
| +2.5 Volts monitor |  |
| +5 Volts monitor |  |
| _ROLL_ROT |  |
| _Roll_DEC |  |
| _Roll_RA |  |
| Veto Counter |  |