| Param | Original file | Final file |
|---|---|---|
| Filename | modeM0/AS1C07_001T11_9000005710cztM0_level2.fits | modeM0/AS1C07_001T11_9000005710cztM0_level2_quad_clean.evt |
| Size (bytes) | 654,059,520 | 1,032,886,080 |
| Size | 623.8 MB | 985.0 MB |
| Events in quadrant A | 3,890,654 | 6,745,770 |
| Events in quadrant B | 3,773,034 | 6,966,002 |
| Events in quadrant C | 3,775,648 | 6,620,986 |
| Events in quadrant D | 3,254,154 | 5,842,980 |
| Mode SS | |||
|---|---|---|---|
| Quadrant | BADHDUFLAG | Total packets | Discarded packets |
| A | 0 | 1526 | 0 |
| B | 0 | 1526 | 0 |
| C | 0 | 1526 | 0 |
| D | 0 | 1526 | 0 |
| Mode M0 | |||
|---|---|---|---|
| Quadrant | BADHDUFLAG | Total packets | Discarded packets |
| A | 0 | 211303 | 0 |
| B | 0 | 159243 | 0 |
| C | 0 | 171102 | 0 |
| D | 0 | 223356 | 0 |
| Mode M9 | |||
|---|---|---|---|
| Quadrant | BADHDUFLAG | Total packets | Discarded packets |
| A | 0 | 304 | 0 |
| B | 0 | 304 | 0 |
| C | 0 | 304 | 0 |
| D | 0 | 304 | 0 |
| Quadrant | Total seconds | Saturated seconds | Saturation percentage |
|---|---|---|---|
| A | 74518 | 3617 | 4.853861% |
| B | 74519 | 488 | 0.654867% |
| C | 74519 | 2240 | 3.005945% |
| D | 74519 | 5470 | 7.340410% |
Noise dominated data is calculated using 1-second bins in cleaned event files. If a bin has >2000 counts, and if more than 50% of those come from <1% of pixels, then it is considered to be noise-dominated and hence unusable.
| Quadrant | # 1 sec bins | Bins with >0 counts | Bins with >2000 counts | High rate bins dominated by noise | Noise dominated (total time) | Noise dominated (detector-on time) | Marked lightcurve |
|---|---|---|---|---|---|---|---|
| A | 104989 | 74508 | 0 | 0 | 0.00% | 0.00% | 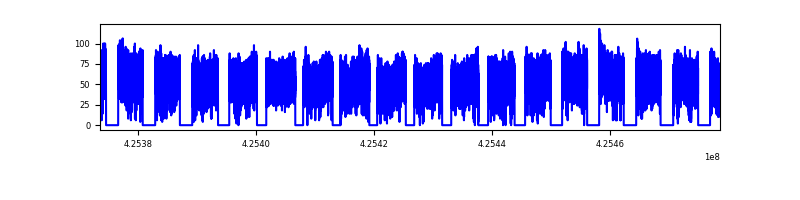 |
| B | 104989 | 74518 | 0 | 0 | 0.00% | 0.00% |  |
| C | 104989 | 74277 | 0 | 0 | 0.00% | 0.00% | 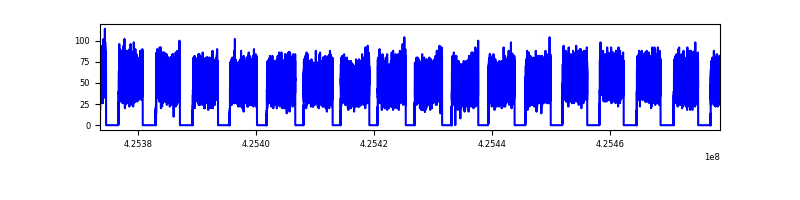 |
| D | 104989 | 74450 | 0 | 0 | 0.00% | 0.00% |  |
Top three noisy pixels from each quadrant. If the there are fewer than three noisy pixels in the level2.evt file, extra rows are filled as -1
| Pixel properties | Quadrant properties | ||||||
|---|---|---|---|---|---|---|---|
| Quadrant | DetID | PixID | Counts | Sigma | Mean | Median | Sigma |
| A | 9 | 19 | 3235 | 8.94 | 1015 | 957 | 254.9 |
| A | 7 | 110 | 3116 | 8.47 | 1015 | 957 | 254.9 |
| A | 0 | 29 | 3044 | 8.19 | 1015 | 957 | 254.9 |
| B | 2 | 9 | 3429 | 13.09 | 999 | 958 | 188.8 |
| B | 3 | 80 | 2811 | 9.81 | 999 | 958 | 188.8 |
| B | 2 | 8 | 2697 | 9.21 | 999 | 958 | 188.8 |
| C | 1 | 81 | 3215 | 8.96 | 998 | 937 | 254.3 |
| C | 1 | 80 | 3114 | 8.56 | 998 | 937 | 254.3 |
| C | 1 | 65 | 2676 | 6.84 | 998 | 937 | 254.3 |
| D | 4 | 160 | 2418 | 6.23 | 931 | 846 | 252.3 |
| D | 7 | 3 | 2396 | 6.14 | 931 | 846 | 252.3 |
| D | 10 | 189 | 2355 | 5.98 | 931 | 846 | 252.3 |
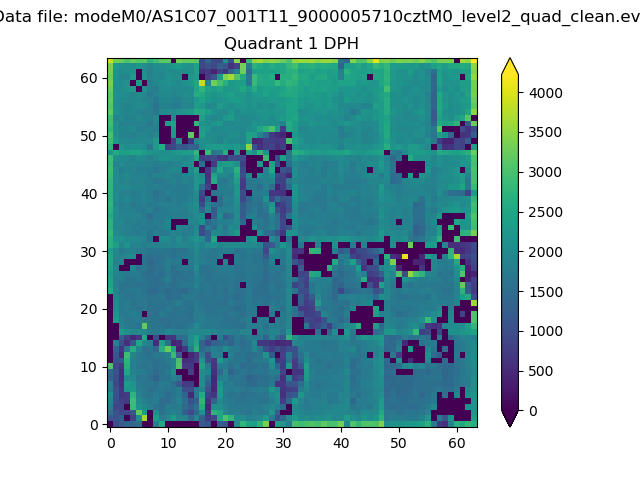
Histogram calculated using DETX and DETY for each event in the final _common_clean file
| Quadrant A |  |
 |
Quadrant B |
|---|---|---|---|
| Quadrant D |  |
 |
Quadrant C |
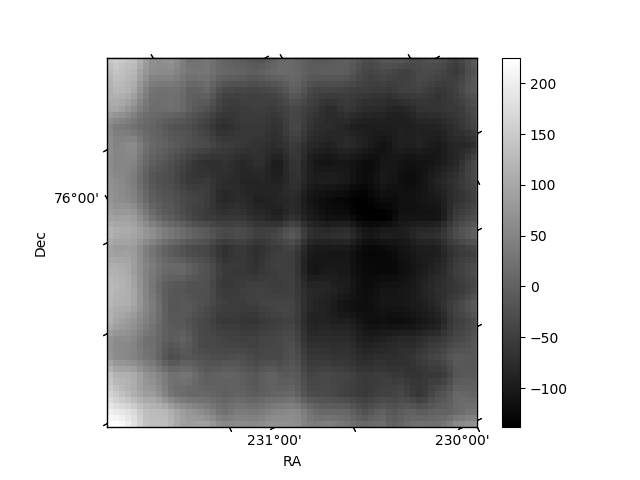
| Plot type | Count rate plots | Images |
|---|---|---|
| Comparison with Poisson distribution Blue bars denote a histogram of data divided into 1 sec bins. Red curve is a Poisson curve with rate = median count rate of data. |
 |
 |
| Quadrant-wise count rates Data is divided into 100 sec bins |
 |
|
| Module-wise count rates for Quadrant A Data is divided into 100 sec bins |
 |
 |
| Module-wise count rates for Quadrant B Data is divided into 100 sec bins |
 |
 |
| Module-wise count rates for Quadrant C Data is divided into 100 sec bins |
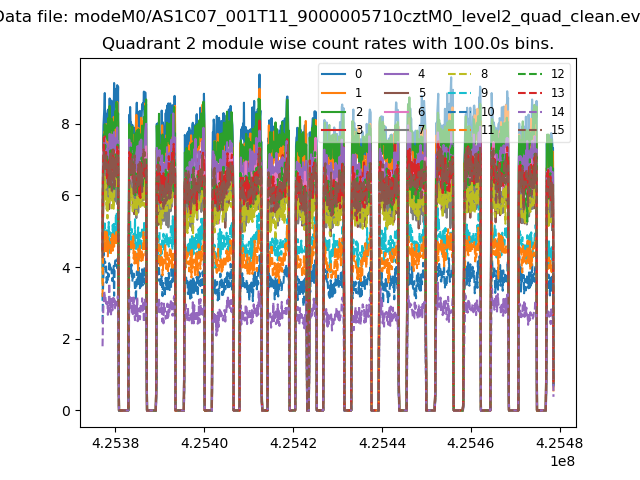 |
 |
| Module-wise count rates for Quadrant D Data is divided into 100 sec bins |
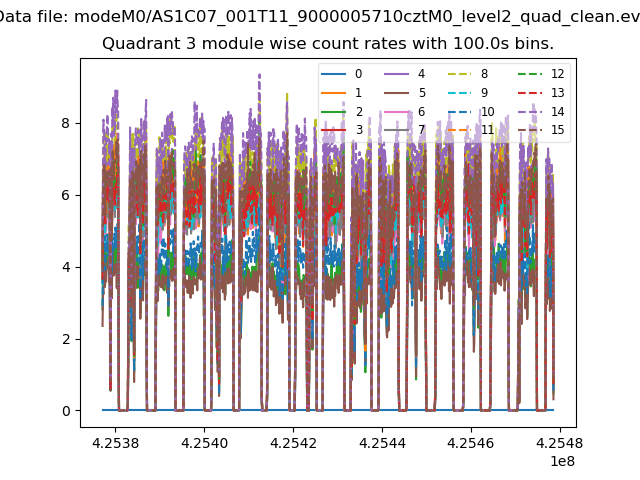 |
 |
| Parameter | Plot |
|---|---|
| CZT HV Monitor |  |
| D_VDD | 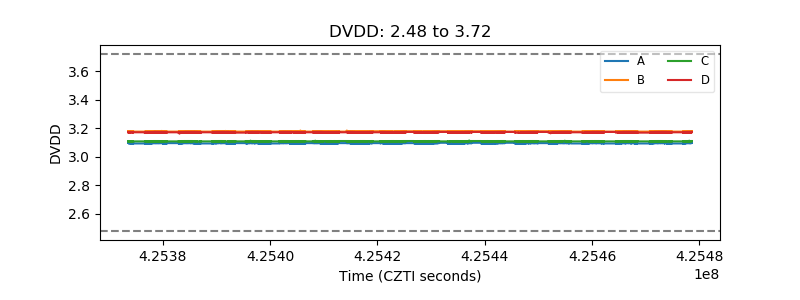 |
| Temperature 1 |  |
| Veto HV Monitor | 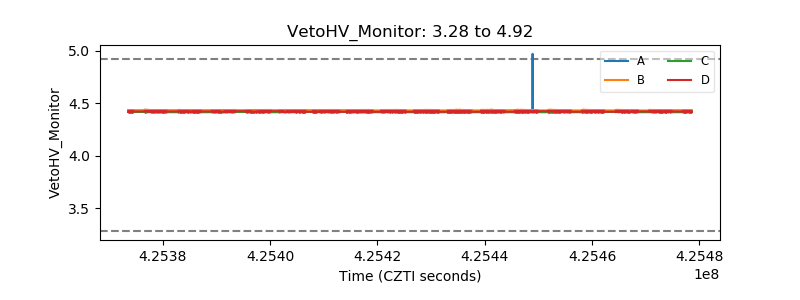 |
| Veto LLD |  |
| Alpha Counter |  |
| _CPM_Rate | 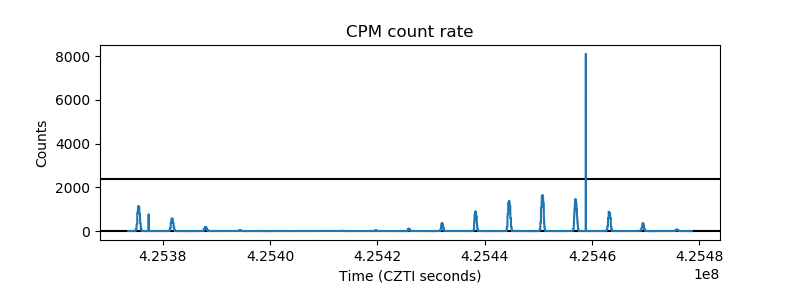 |
| CZT Counter |  |
| +2.5 Volts monitor |  |
| +5 Volts monitor |  |
| _ROLL_ROT |  |
| _Roll_DEC |  |
| _Roll_RA | 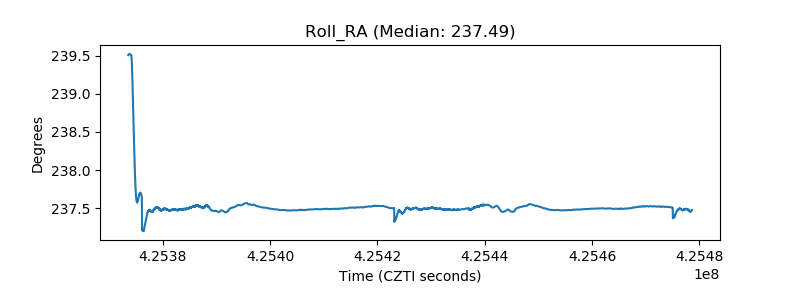 |
| Veto Counter |  |