| Param | Original file | Final file |
|---|---|---|
| Filename | modeM0/AS1A12_087T01_9000005702cztM0_level2.fits | modeM0/AS1A12_087T01_9000005702cztM0_level2_quad_clean.evt |
| Size (bytes) | 379,359,360 | 342,141,120 |
| Size | 361.8 MB | 326.3 MB |
| Events in quadrant A | 2,300,392 | 1,959,056 |
| Events in quadrant B | 2,193,202 | 1,975,617 |
| Events in quadrant C | 2,192,928 | 1,841,073 |
| Events in quadrant D | 1,908,802 | 1,692,340 |
| Mode M0 | |||
|---|---|---|---|
| Quadrant | BADHDUFLAG | Total packets | Discarded packets |
| A | 0 | 95620 | 0 |
| B | 0 | 85730 | 0 |
| C | 0 | 96419 | 0 |
| D | 0 | 107481 | 0 |
| Mode SS | |||
|---|---|---|---|
| Quadrant | BADHDUFLAG | Total packets | Discarded packets |
| A | 0 | 862 | 0 |
| B | 0 | 862 | 0 |
| C | 0 | 862 | 0 |
| D | 0 | 862 | 0 |
| Mode M9 | |||
|---|---|---|---|
| Quadrant | BADHDUFLAG | Total packets | Discarded packets |
| A | 0 | 166 | 0 |
| B | 0 | 167 | 0 |
| C | 0 | 167 | 0 |
| D | 0 | 167 | 0 |
| Quadrant | Total seconds | Saturated seconds | Saturation percentage |
|---|---|---|---|
| A | 42129 | 188 | 0.446248% |
| B | 42129 | 76 | 0.180398% |
| C | 42128 | 1415 | 3.358811% |
| D | 42129 | 1997 | 4.740203% |
Noise dominated data is calculated using 1-second bins in cleaned event files. If a bin has >2000 counts, and if more than 50% of those come from <1% of pixels, then it is considered to be noise-dominated and hence unusable.
| Quadrant | # 1 sec bins | Bins with >0 counts | Bins with >2000 counts | High rate bins dominated by noise | Noise dominated (total time) | Noise dominated (detector-on time) | Marked lightcurve |
|---|---|---|---|---|---|---|---|
| A | 63157 | 42119 | 0 | 0 | 0.00% | 0.00% |  |
| B | 63156 | 42119 | 0 | 0 | 0.00% | 0.00% |  |
| C | 63156 | 41937 | 0 | 0 | 0.00% | 0.00% |  |
| D | 63156 | 41594 | 0 | 0 | 0.00% | 0.00% |  |
Top three noisy pixels from each quadrant. If the there are fewer than three noisy pixels in the level2.evt file, extra rows are filled as -1
| Pixel properties | Quadrant properties | ||||||
|---|---|---|---|---|---|---|---|
| Quadrant | DetID | PixID | Counts | Sigma | Mean | Median | Sigma |
| A | 0 | 29 | 1913 | 8.94 | 600 | 562 | 151.1 |
| A | 7 | 110 | 1894 | 8.81 | 600 | 562 | 151.1 |
| A | 9 | 19 | 1818 | 8.31 | 600 | 562 | 151.1 |
| B | 2 | 9 | 1960 | 12.33 | 580 | 554 | 114.1 |
| B | 3 | 80 | 1603 | 9.2 | 580 | 554 | 114.1 |
| B | 2 | 8 | 1573 | 8.93 | 580 | 554 | 114.1 |
| C | 1 | 81 | 1813 | 8.5 | 579 | 541 | 149.7 |
| C | 1 | 80 | 1737 | 7.99 | 579 | 541 | 149.7 |
| C | 1 | 65 | 1529 | 6.6 | 579 | 541 | 149.7 |
| D | 10 | 189 | 1430 | 6.39 | 545 | 497 | 146.0 |
| D | 7 | 3 | 1405 | 6.22 | 545 | 497 | 146.0 |
| D | 4 | 160 | 1397 | 6.16 | 545 | 497 | 146.0 |
Histogram calculated using DETX and DETY for each event in the final _common_clean file
| Quadrant A |  |
 |
Quadrant B |
|---|---|---|---|
| Quadrant D |  |
 |
Quadrant C |
| Plot type | Count rate plots | Images |
|---|---|---|
| Comparison with Poisson distribution Blue bars denote a histogram of data divided into 1 sec bins. Red curve is a Poisson curve with rate = median count rate of data. |
 |
 |
| Quadrant-wise count rates Data is divided into 100 sec bins |
 |
|
| Module-wise count rates for Quadrant A Data is divided into 100 sec bins |
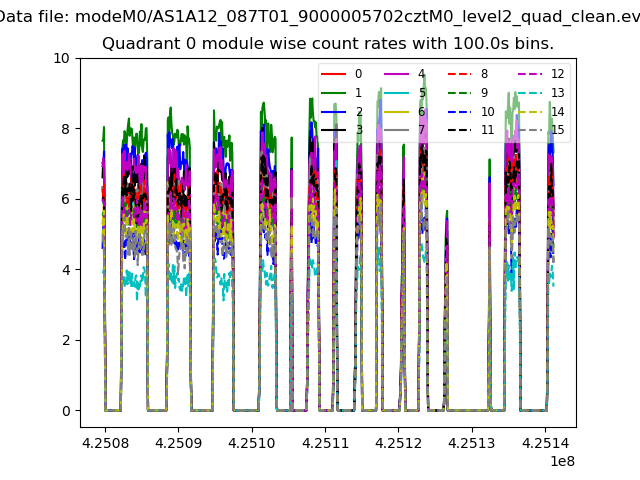 |
 |
| Module-wise count rates for Quadrant B Data is divided into 100 sec bins |
 |
 |
| Module-wise count rates for Quadrant C Data is divided into 100 sec bins |
 |
 |
| Module-wise count rates for Quadrant D Data is divided into 100 sec bins |
 |
 |
| Parameter | Plot |
|---|---|
| CZT HV Monitor |  |
| D_VDD |  |
| Temperature 1 |  |
| Veto HV Monitor |  |
| Veto LLD |  |
| Alpha Counter |  |
| _CPM_Rate |  |
| CZT Counter |  |
| +2.5 Volts monitor | 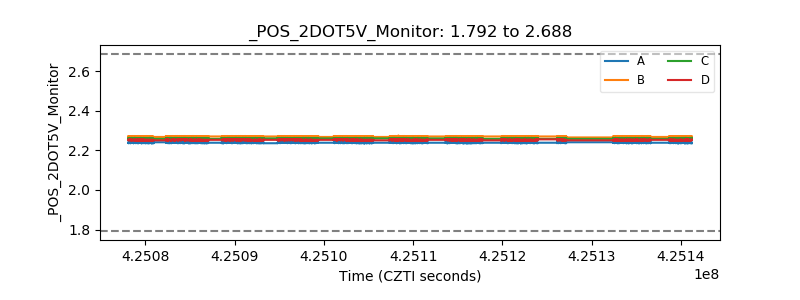 |
| +5 Volts monitor |  |
| _ROLL_ROT |  |
| _Roll_DEC |  |
| _Roll_RA | 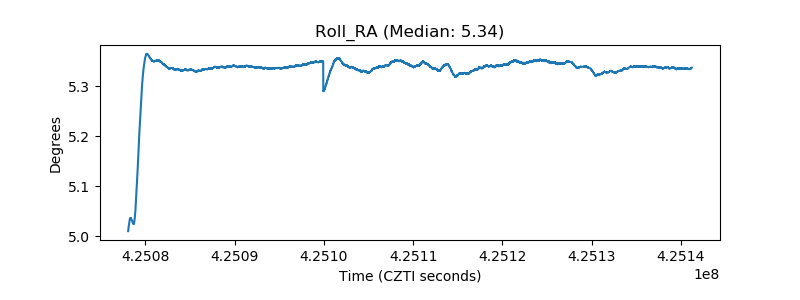 |
| Veto Counter |  |