| Param | Original file | Final file |
|---|---|---|
| Filename | modeM0/AS1A12_077T11_9000005696cztM0_level2.fits | modeM0/AS1A12_077T11_9000005696cztM0_level2_quad_clean.evt |
| Size (bytes) | 1,062,241,920 | 1,157,238,720 |
| Size | 1013.0 MB | 1.1 GB |
| Events in quadrant A | 6,483,022 | 7,267,812 |
| Events in quadrant B | 6,203,052 | 7,284,785 |
| Events in quadrant C | 6,148,680 | 6,697,370 |
| Events in quadrant D | 5,184,348 | 5,654,544 |
| Mode M9 | |||
|---|---|---|---|
| Quadrant | BADHDUFLAG | Total packets | Discarded packets |
| A | 0 | 451 | 0 |
| B | 0 | 451 | 0 |
| C | 0 | 452 | 0 |
| D | 0 | 452 | 0 |
| Mode M0 | |||
|---|---|---|---|
| Quadrant | BADHDUFLAG | Total packets | Discarded packets |
| A | 0 | 263549 | 0 |
| B | 0 | 253081 | 0 |
| C | 0 | 285680 | 0 |
| D | 0 | 458947 | 0 |
| Mode SS | |||
|---|---|---|---|
| Quadrant | BADHDUFLAG | Total packets | Discarded packets |
| A | 0 | 2430 | 0 |
| B | 0 | 2432 | 0 |
| C | 0 | 2432 | 0 |
| D | 0 | 2432 | 0 |
| Quadrant | Total seconds | Saturated seconds | Saturation percentage |
|---|---|---|---|
| A | 118843 | 768 | 0.646231% |
| B | 118843 | 1006 | 0.846495% |
| C | 118835 | 3924 | 3.302057% |
| D | 118802 | 12859 | 10.823892% |
Noise dominated data is calculated using 1-second bins in cleaned event files. If a bin has >2000 counts, and if more than 50% of those come from <1% of pixels, then it is considered to be noise-dominated and hence unusable.
| Quadrant | # 1 sec bins | Bins with >0 counts | Bins with >2000 counts | High rate bins dominated by noise | Noise dominated (total time) | Noise dominated (detector-on time) | Marked lightcurve |
|---|---|---|---|---|---|---|---|
| A | 166884 | 118820 | 0 | 0 | 0.00% | 0.00% | 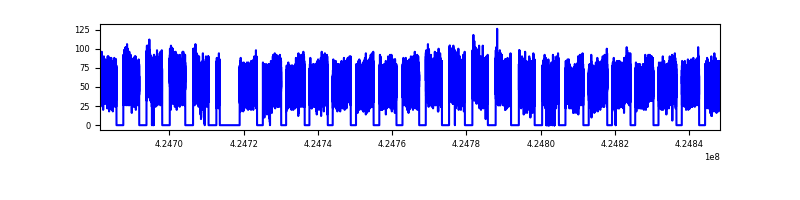 |
| B | 166884 | 118830 | 0 | 0 | 0.00% | 0.00% |  |
| C | 166884 | 118292 | 0 | 0 | 0.00% | 0.00% |  |
| D | 166884 | 118597 | 0 | 0 | 0.00% | 0.00% | 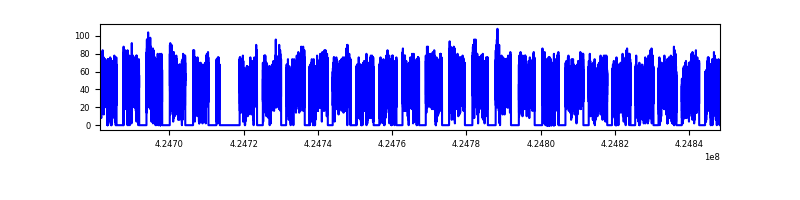 |
Top three noisy pixels from each quadrant. If the there are fewer than three noisy pixels in the level2.evt file, extra rows are filled as -1
| Pixel properties | Quadrant properties | ||||||
|---|---|---|---|---|---|---|---|
| Quadrant | DetID | PixID | Counts | Sigma | Mean | Median | Sigma |
| A | 7 | 110 | 5387 | 9.0 | 1691 | 1581 | 423.0 |
| A | 9 | 19 | 5241 | 8.65 | 1691 | 1581 | 423.0 |
| A | 0 | 29 | 5191 | 8.53 | 1691 | 1581 | 423.0 |
| B | 2 | 9 | 5375 | 11.8 | 1639 | 1556 | 323.6 |
| B | 3 | 80 | 4409 | 8.81 | 1639 | 1556 | 323.6 |
| B | 3 | 17 | 4289 | 8.44 | 1639 | 1556 | 323.6 |
| C | 1 | 81 | 4900 | 8.14 | 1624 | 1518 | 415.7 |
| C | 3 | 202 | 4829 | 7.96 | 1624 | 1518 | 415.7 |
| C | 1 | 80 | 4799 | 7.89 | 1624 | 1518 | 415.7 |
| D | 7 | 3 | 3811 | 6.2 | 1484 | 1352 | 396.7 |
| D | 3 | 14 | 3734 | 6.0 | 1484 | 1352 | 396.7 |
| D | 4 | 160 | 3696 | 5.91 | 1484 | 1352 | 396.7 |
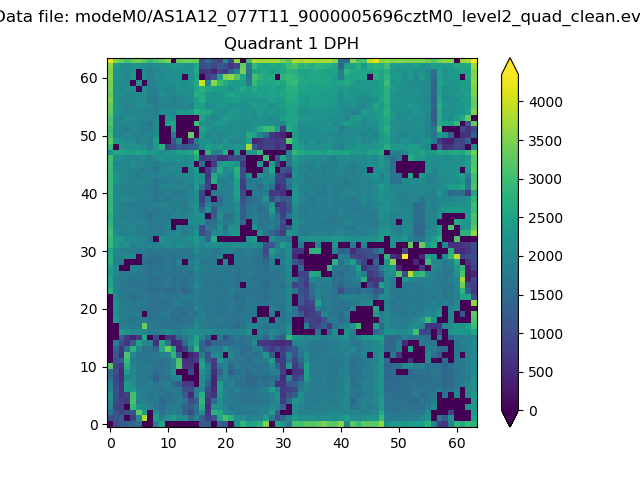
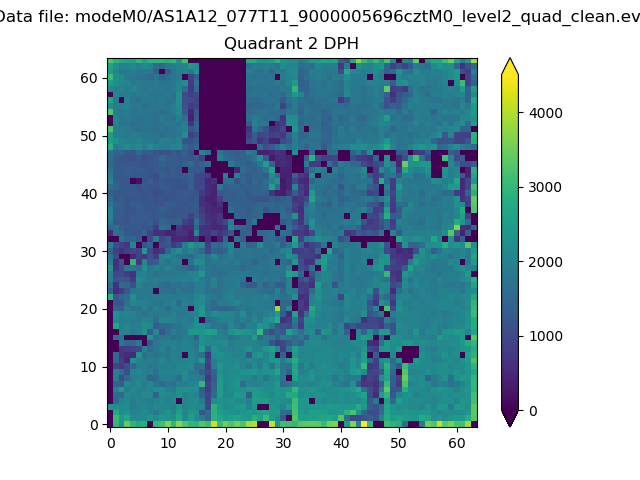
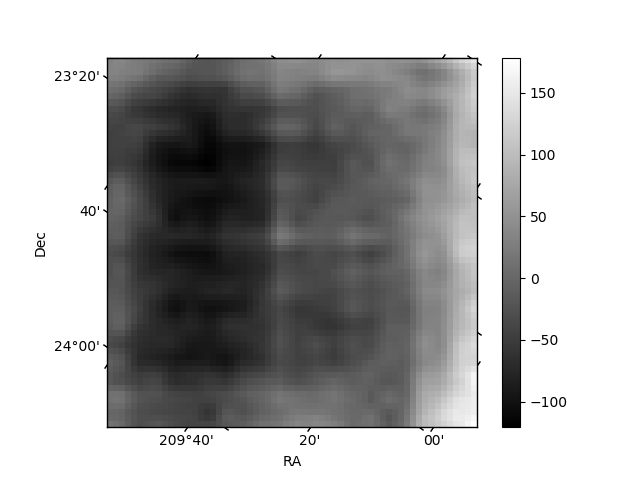
Histogram calculated using DETX and DETY for each event in the final _common_clean file
| Quadrant A |  |
 |
Quadrant B |
|---|---|---|---|
| Quadrant D |  |
 |
Quadrant C |
| Plot type | Count rate plots | Images |
|---|---|---|
| Comparison with Poisson distribution Blue bars denote a histogram of data divided into 1 sec bins. Red curve is a Poisson curve with rate = median count rate of data. |
 |
 |
| Quadrant-wise count rates Data is divided into 100 sec bins |
 |
|
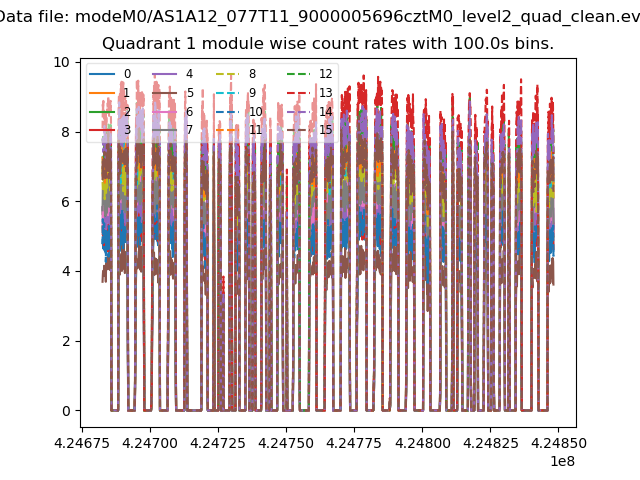
| Module-wise count rates for Quadrant A Data is divided into 100 sec bins |
 |
 |
| Module-wise count rates for Quadrant B Data is divided into 100 sec bins |
 |
 |
| Module-wise count rates for Quadrant C Data is divided into 100 sec bins |
 |
 |
| Module-wise count rates for Quadrant D Data is divided into 100 sec bins |
 |
 |
| Parameter | Plot |
|---|---|
| CZT HV Monitor |  |
| D_VDD |  |
| Temperature 1 |  |
| Veto HV Monitor |  |
| Veto LLD |  |
| Alpha Counter |  |
| _CPM_Rate | 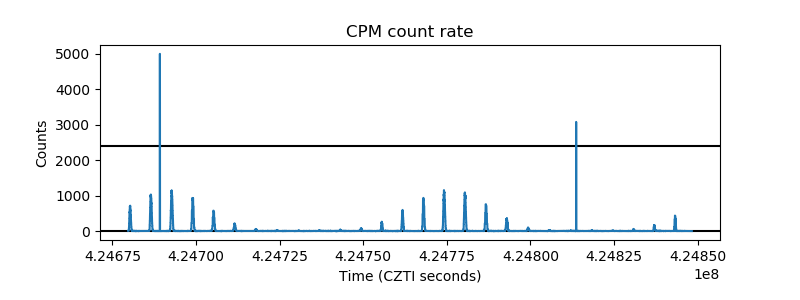 |
| CZT Counter | 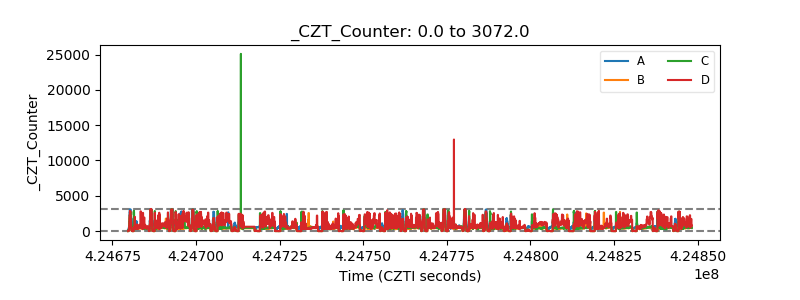 |
| +2.5 Volts monitor | 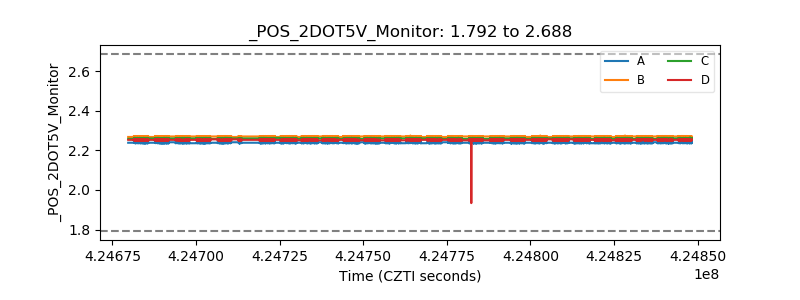 |
| +5 Volts monitor |  |
| _ROLL_ROT |  |
| _Roll_DEC |  |
| _Roll_RA |  |
| Veto Counter | 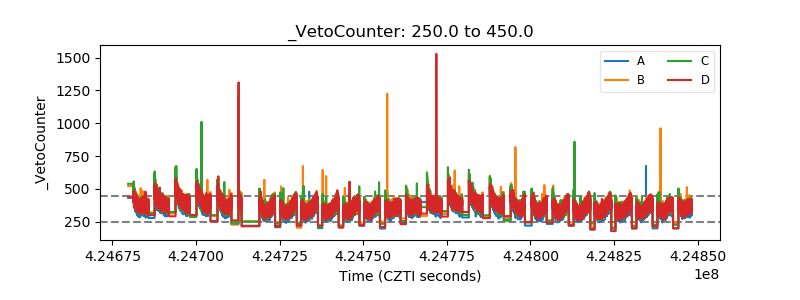 |