| Param | Original file | Final file |
|---|---|---|
| Filename | modeM0/AS1T05_117T01_9000005684cztM0_level2.fits | modeM0/AS1T05_117T01_9000005684cztM0_level2_quad_clean.evt |
| Size (bytes) | 314,591,040 | 341,530,560 |
| Size | 300.0 MB | 325.7 MB |
| Events in quadrant A | 1,873,114 | 2,081,949 |
| Events in quadrant B | 1,806,438 | 2,098,478 |
| Events in quadrant C | 1,830,108 | 1,978,944 |
| Events in quadrant D | 1,545,678 | 1,712,438 |
| Mode SS | |||
|---|---|---|---|
| Quadrant | BADHDUFLAG | Total packets | Discarded packets |
| A | 0 | 738 | 0 |
| B | 0 | 738 | 0 |
| C | 0 | 738 | 0 |
| D | 0 | 738 | 0 |
| Mode M9 | |||
|---|---|---|---|
| Quadrant | BADHDUFLAG | Total packets | Discarded packets |
| A | 0 | 100 | 0 |
| B | 0 | 100 | 0 |
| C | 0 | 100 | 0 |
| D | 0 | 100 | 0 |
| Mode M0 | |||
|---|---|---|---|
| Quadrant | BADHDUFLAG | Total packets | Discarded packets |
| A | 0 | 77508 | 0 |
| B | 0 | 74248 | 0 |
| C | 0 | 77210 | 0 |
| D | 0 | 104594 | 0 |
| Quadrant | Total seconds | Saturated seconds | Saturation percentage |
|---|---|---|---|
| A | 35962 | 128 | 0.355931% |
| B | 35962 | 60 | 0.166843% |
| C | 35962 | 332 | 0.923197% |
| D | 35962 | 2659 | 7.393916% |
Noise dominated data is calculated using 1-second bins in cleaned event files. If a bin has >2000 counts, and if more than 50% of those come from <1% of pixels, then it is considered to be noise-dominated and hence unusable.
| Quadrant | # 1 sec bins | Bins with >0 counts | Bins with >2000 counts | High rate bins dominated by noise | Noise dominated (total time) | Noise dominated (detector-on time) | Marked lightcurve |
|---|---|---|---|---|---|---|---|
| A | 46173 | 35962 | 0 | 0 | 0.00% | 0.00% |  |
| B | 46173 | 35961 | 0 | 0 | 0.00% | 0.00% |  |
| C | 46173 | 35948 | 0 | 0 | 0.00% | 0.00% |  |
| D | 46173 | 35916 | 0 | 0 | 0.00% | 0.00% |  |
Top three noisy pixels from each quadrant. If the there are fewer than three noisy pixels in the level2.evt file, extra rows are filled as -1
| Pixel properties | Quadrant properties | ||||||
|---|---|---|---|---|---|---|---|
| Quadrant | DetID | PixID | Counts | Sigma | Mean | Median | Sigma |
| A | 0 | 29 | 1526 | 8.54 | 488 | 457 | 125.1 |
| A | 7 | 110 | 1505 | 8.37 | 488 | 457 | 125.1 |
| A | 9 | 19 | 1504 | 8.37 | 488 | 457 | 125.1 |
| B | 2 | 9 | 1540 | 11.45 | 476 | 452 | 95.0 |
| B | 3 | 80 | 1305 | 8.98 | 476 | 452 | 95.0 |
| B | 3 | 17 | 1235 | 8.24 | 476 | 452 | 95.0 |
| C | 1 | 81 | 1585 | 9.2 | 482 | 451 | 123.2 |
| C | 1 | 80 | 1542 | 8.85 | 482 | 451 | 123.2 |
| C | 3 | 202 | 1486 | 8.4 | 482 | 451 | 123.2 |
| D | 6 | 38 | 1136 | 6.16 | 442 | 402 | 119.3 |
| D | 4 | 160 | 1128 | 6.09 | 442 | 402 | 119.3 |
| D | 10 | 189 | 1122 | 6.04 | 442 | 402 | 119.3 |
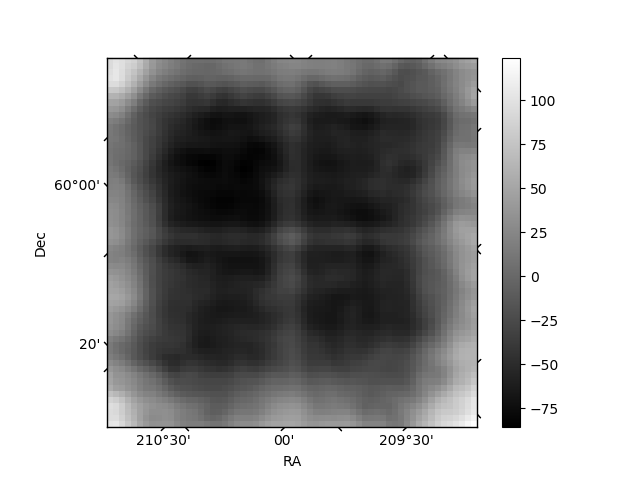
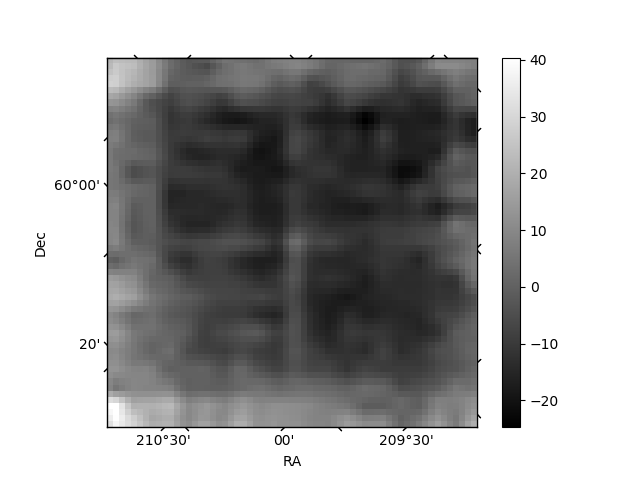
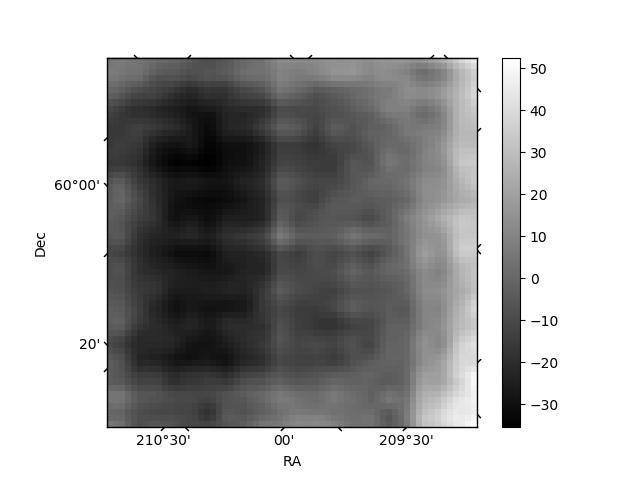
Histogram calculated using DETX and DETY for each event in the final _common_clean file
| Quadrant A |  |
 |
Quadrant B |
|---|---|---|---|
| Quadrant D |  |
 |
Quadrant C |
| Plot type | Count rate plots | Images |
|---|---|---|
| Comparison with Poisson distribution Blue bars denote a histogram of data divided into 1 sec bins. Red curve is a Poisson curve with rate = median count rate of data. |
 |
 |
| Quadrant-wise count rates Data is divided into 100 sec bins |
 |
|
| Module-wise count rates for Quadrant A Data is divided into 100 sec bins |
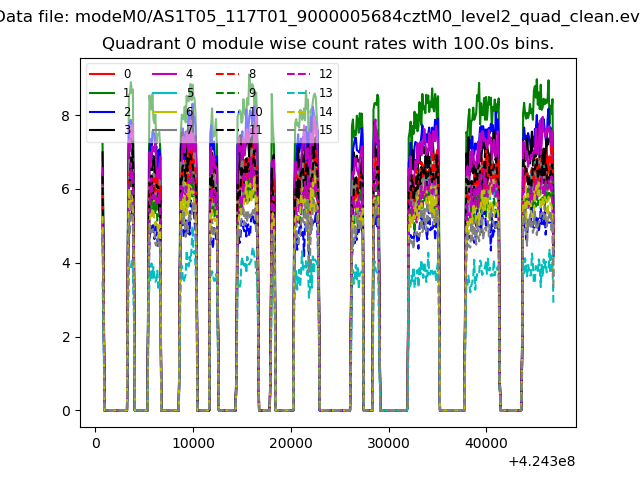 |
 |
| Module-wise count rates for Quadrant B Data is divided into 100 sec bins |
 |
 |
| Module-wise count rates for Quadrant C Data is divided into 100 sec bins |
 |
 |
| Module-wise count rates for Quadrant D Data is divided into 100 sec bins |
 |
 |
| Parameter | Plot |
|---|---|
| CZT HV Monitor |  |
| D_VDD | 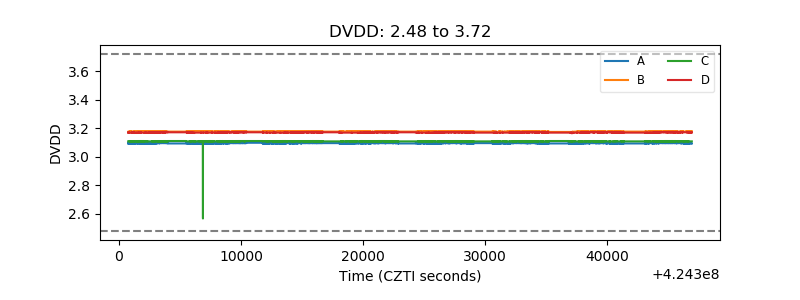 |
| Temperature 1 |  |
| Veto HV Monitor | 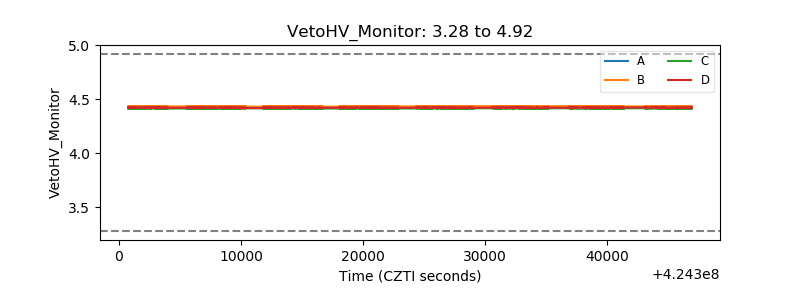 |
| Veto LLD | 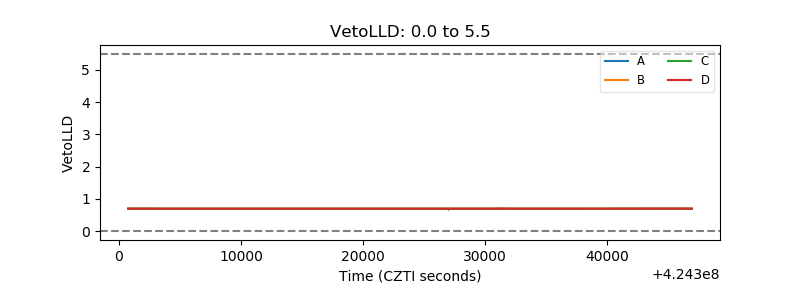 |
| Alpha Counter |  |
| _CPM_Rate |  |
| CZT Counter |  |
| +2.5 Volts monitor |  |
| +5 Volts monitor | 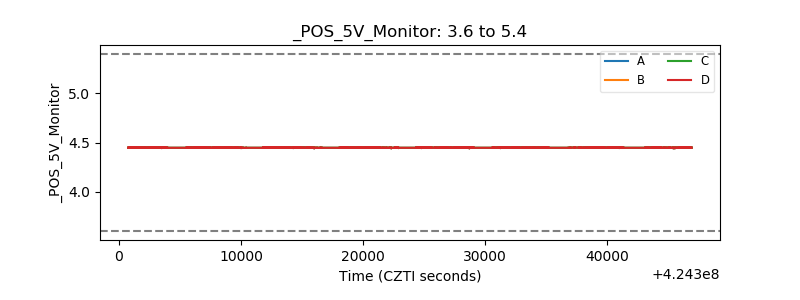 |
| _ROLL_ROT | 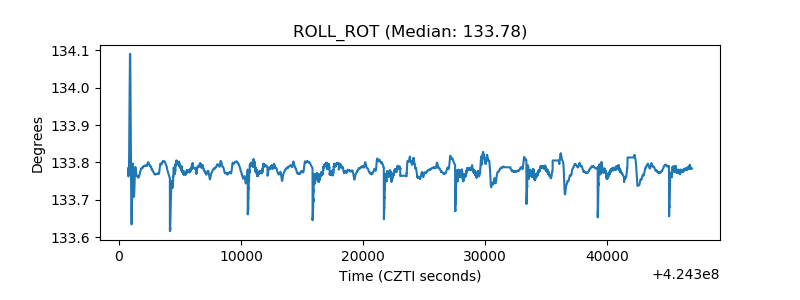 |
| _Roll_DEC |  |
| _Roll_RA |  |
| Veto Counter |  |