| Param | Original file | Final file |
|---|---|---|
| Filename | modeM0/AS1T05_116T01_9000005682cztM0_level2.fits | modeM0/AS1T05_116T01_9000005682cztM0_level2_quad_clean.evt |
| Size (bytes) | 852,883,200 | 953,812,800 |
| Size | 813.4 MB | 909.6 MB |
| Events in quadrant A | 5,143,420 | 5,945,931 |
| Events in quadrant B | 4,924,074 | 5,859,732 |
| Events in quadrant C | 4,954,936 | 5,556,545 |
| Events in quadrant D | 4,258,128 | 4,980,971 |
| Mode M0 | |||
|---|---|---|---|
| Quadrant | BADHDUFLAG | Total packets | Discarded packets |
| A | 0 | 206517 | 0 |
| B | 0 | 208483 | 0 |
| C | 0 | 219030 | 0 |
| D | 0 | 279301 | 0 |
| Mode M9 | |||
|---|---|---|---|
| Quadrant | BADHDUFLAG | Total packets | Discarded packets |
| A | 0 | 392 | 0 |
| B | 0 | 393 | 0 |
| C | 0 | 393 | 0 |
| D | 0 | 393 | 0 |
| Mode SS | |||
|---|---|---|---|
| Quadrant | BADHDUFLAG | Total packets | Discarded packets |
| A | 0 | 1954 | 0 |
| B | 0 | 1954 | 0 |
| C | 0 | 1954 | 0 |
| D | 0 | 1954 | 0 |
| Quadrant | Total seconds | Saturated seconds | Saturation percentage |
|---|---|---|---|
| A | 95479 | 274 | 0.286974% |
| B | 95479 | 1272 | 1.332230% |
| C | 95480 | 3540 | 3.707583% |
| D | 95480 | 7153 | 7.491621% |
Noise dominated data is calculated using 1-second bins in cleaned event files. If a bin has >2000 counts, and if more than 50% of those come from <1% of pixels, then it is considered to be noise-dominated and hence unusable.
| Quadrant | # 1 sec bins | Bins with >0 counts | Bins with >2000 counts | High rate bins dominated by noise | Noise dominated (total time) | Noise dominated (detector-on time) | Marked lightcurve |
|---|---|---|---|---|---|---|---|
| A | 159875 | 95481 | 0 | 0 | 0.00% | 0.00% |  |
| B | 159875 | 95476 | 0 | 0 | 0.00% | 0.00% |  |
| C | 159875 | 94794 | 0 | 0 | 0.00% | 0.00% |  |
| D | 159875 | 95367 | 0 | 0 | 0.00% | 0.00% |  |
Top three noisy pixels from each quadrant. If the there are fewer than three noisy pixels in the level2.evt file, extra rows are filled as -1
| Pixel properties | Quadrant properties | ||||||
|---|---|---|---|---|---|---|---|
| Quadrant | DetID | PixID | Counts | Sigma | Mean | Median | Sigma |
| A | 7 | 110 | 4246 | 8.96 | 1345 | 1261 | 333.0 |
| A | 0 | 29 | 4224 | 8.9 | 1345 | 1261 | 333.0 |
| A | 9 | 19 | 4195 | 8.81 | 1345 | 1261 | 333.0 |
| B | 2 | 9 | 4179 | 11.68 | 1302 | 1241 | 251.6 |
| B | 3 | 80 | 3540 | 9.14 | 1302 | 1241 | 251.6 |
| B | 3 | 17 | 3449 | 8.78 | 1302 | 1241 | 251.6 |
| C | 3 | 202 | 4110 | 8.65 | 1307 | 1223 | 333.8 |
| C | 1 | 81 | 4012 | 8.35 | 1307 | 1223 | 333.8 |
| C | 3 | 203 | 3945 | 8.15 | 1307 | 1223 | 333.8 |
| D | 7 | 3 | 3179 | 6.38 | 1219 | 1115 | 323.4 |
| D | 4 | 160 | 3160 | 6.32 | 1219 | 1115 | 323.4 |
| D | 10 | 189 | 3133 | 6.24 | 1219 | 1115 | 323.4 |
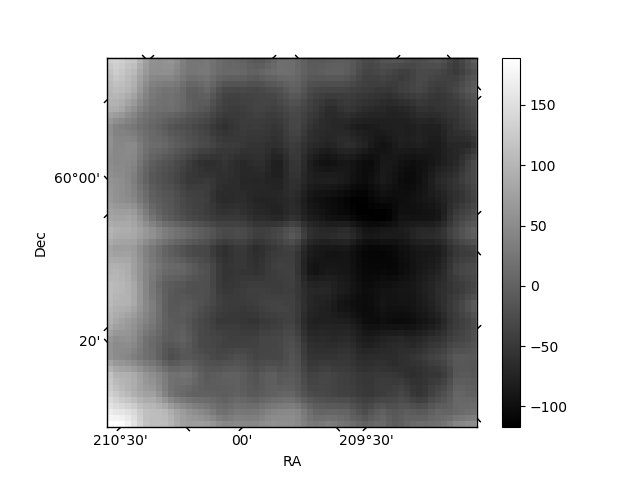
Histogram calculated using DETX and DETY for each event in the final _common_clean file
| Quadrant A |  |
 |
Quadrant B |
|---|---|---|---|
| Quadrant D |  |
 |
Quadrant C |
| Plot type | Count rate plots | Images |
|---|---|---|
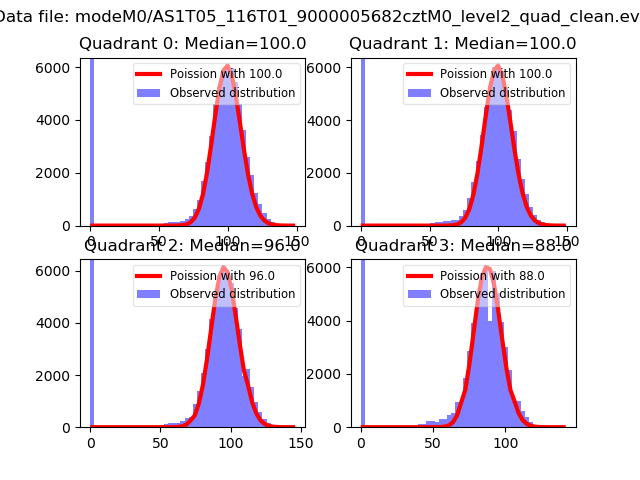
| Comparison with Poisson distribution Blue bars denote a histogram of data divided into 1 sec bins. Red curve is a Poisson curve with rate = median count rate of data. |
 |
 |
| Quadrant-wise count rates Data is divided into 100 sec bins |
 |
|
| Module-wise count rates for Quadrant A Data is divided into 100 sec bins |
 |
 |
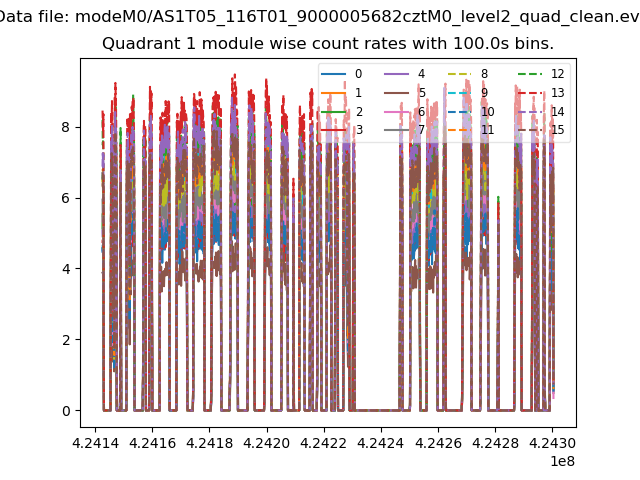
| Module-wise count rates for Quadrant B Data is divided into 100 sec bins |
 |
 |
| Module-wise count rates for Quadrant C Data is divided into 100 sec bins |
 |
 |
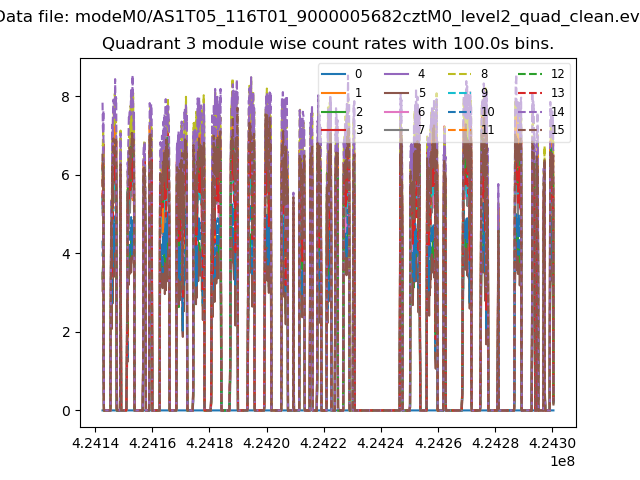
| Module-wise count rates for Quadrant D Data is divided into 100 sec bins |
 |
 |
| Parameter | Plot |
|---|---|
| CZT HV Monitor |  |
| D_VDD |  |
| Temperature 1 |  |
| Veto HV Monitor |  |
| Veto LLD |  |
| Alpha Counter |  |
| _CPM_Rate | 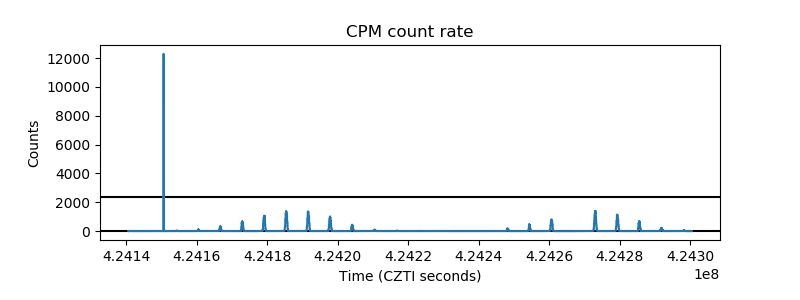 |
| CZT Counter | 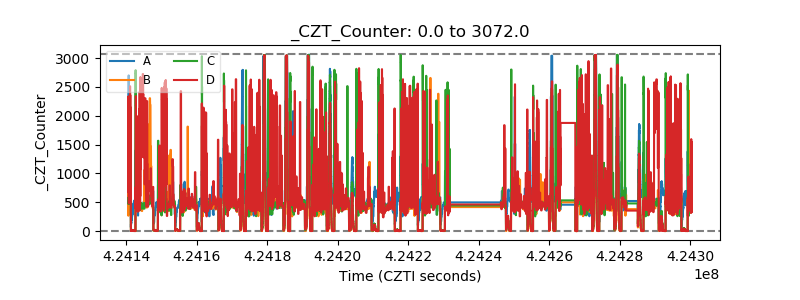 |
| +2.5 Volts monitor |  |
| +5 Volts monitor |  |
| _ROLL_ROT |  |
| _Roll_DEC | 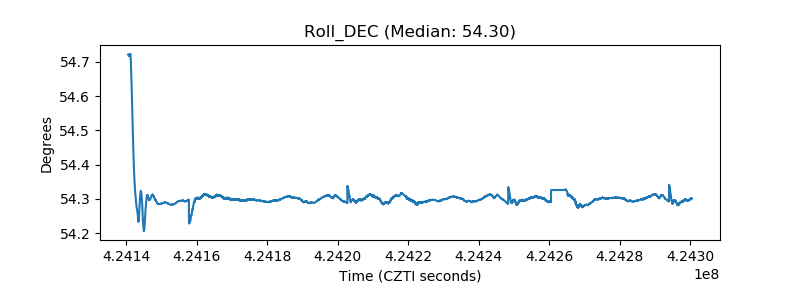 |
| _Roll_RA |  |
| Veto Counter |  |