| Param | Original file | Final file |
|---|---|---|
| Filename | modeM0/AS1A12_035T02_9000005680cztM0_level2.fits | modeM0/AS1A12_035T02_9000005680cztM0_level2_quad_clean.evt |
| Size (bytes) | 1,303,030,080 | 1,444,305,600 |
| Size | 1.2 GB | 1.3 GB |
| Events in quadrant A | 8,159,694 | 9,581,282 |
| Events in quadrant B | 7,847,704 | 9,612,581 |
| Events in quadrant C | 7,588,544 | 8,480,395 |
| Events in quadrant D | 5,744,496 | 5,972,488 |
| Mode SS | |||
|---|---|---|---|
| Quadrant | BADHDUFLAG | Total packets | Discarded packets |
| A | 0 | 3016 | 0 |
| B | 0 | 3016 | 0 |
| C | 0 | 3016 | 0 |
| D | 0 | 3016 | 0 |
| Mode M0 | |||
|---|---|---|---|
| Quadrant | BADHDUFLAG | Total packets | Discarded packets |
| A | 0 | 318843 | 0 |
| B | 0 | 320383 | 0 |
| C | 0 | 374403 | 0 |
| D | 0 | 709142 | 0 |
| Mode M9 | |||
|---|---|---|---|
| Quadrant | BADHDUFLAG | Total packets | Discarded packets |
| A | 0 | 587 | 0 |
| B | 0 | 587 | 0 |
| C | 0 | 588 | 0 |
| D | 0 | 588 | 0 |
| Quadrant | Total seconds | Saturated seconds | Saturation percentage |
|---|---|---|---|
| A | 147344 | 410 | 0.278260% |
| B | 147345 | 1670 | 1.133394% |
| C | 147345 | 8990 | 6.101327% |
| D | 147346 | 47220 | 32.047019% |
Noise dominated data is calculated using 1-second bins in cleaned event files. If a bin has >2000 counts, and if more than 50% of those come from <1% of pixels, then it is considered to be noise-dominated and hence unusable.
| Quadrant | # 1 sec bins | Bins with >0 counts | Bins with >2000 counts | High rate bins dominated by noise | Noise dominated (total time) | Noise dominated (detector-on time) | Marked lightcurve |
|---|---|---|---|---|---|---|---|
| A | 221993 | 147344 | 0 | 0 | 0.00% | 0.00% | 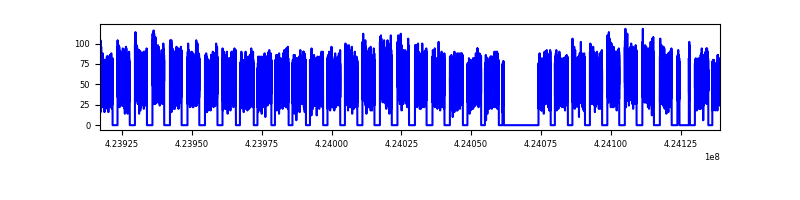 |
| B | 221993 | 147345 | 0 | 0 | 0.00% | 0.00% |  |
| C | 221993 | 146842 | 0 | 0 | 0.00% | 0.00% |  |
| D | 221993 | 146969 | 0 | 0 | 0.00% | 0.00% |  |
Top three noisy pixels from each quadrant. If the there are fewer than three noisy pixels in the level2.evt file, extra rows are filled as -1
| Pixel properties | Quadrant properties | ||||||
|---|---|---|---|---|---|---|---|
| Quadrant | DetID | PixID | Counts | Sigma | Mean | Median | Sigma |
| A | 9 | 19 | 6736 | 9.02 | 2133 | 2007 | 524.4 |
| A | 7 | 110 | 6695 | 8.94 | 2133 | 2007 | 524.4 |
| A | 0 | 29 | 6597 | 8.75 | 2133 | 2007 | 524.4 |
| B | 2 | 9 | 6833 | 12.08 | 2077 | 1983 | 401.5 |
| B | 3 | 17 | 5550 | 8.88 | 2077 | 1983 | 401.5 |
| B | 3 | 80 | 5512 | 8.79 | 2077 | 1983 | 401.5 |
| C | 1 | 81 | 6316 | 8.71 | 2005 | 1880 | 509.2 |
| C | 3 | 203 | 6005 | 8.1 | 2005 | 1880 | 509.2 |
| C | 1 | 80 | 5994 | 8.08 | 2005 | 1880 | 509.2 |
| D | 7 | 3 | 4383 | 6.55 | 1645 | 1497 | 440.4 |
| D | 10 | 189 | 4288 | 6.34 | 1645 | 1497 | 440.4 |
| D | 3 | 14 | 4158 | 6.04 | 1645 | 1497 | 440.4 |
Histogram calculated using DETX and DETY for each event in the final _common_clean file
| Quadrant A |  |
 |
Quadrant B |
|---|---|---|---|
| Quadrant D |  |
 |
Quadrant C |
| Plot type | Count rate plots | Images |
|---|---|---|
| Comparison with Poisson distribution Blue bars denote a histogram of data divided into 1 sec bins. Red curve is a Poisson curve with rate = median count rate of data. |
 |
 |
| Quadrant-wise count rates Data is divided into 100 sec bins |
 |
|
| Module-wise count rates for Quadrant A Data is divided into 100 sec bins |
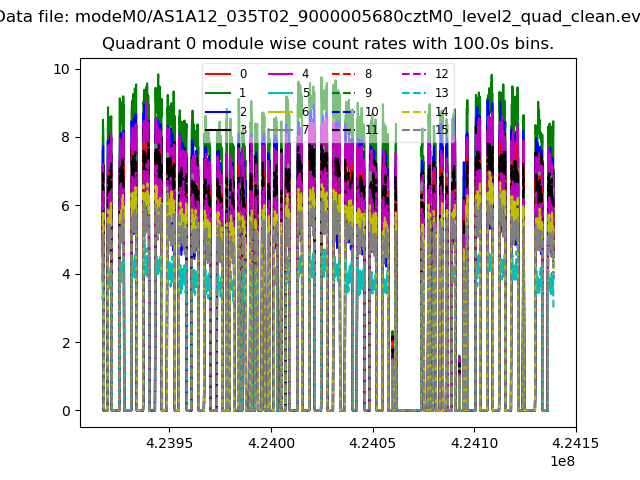 |
 |
| Module-wise count rates for Quadrant B Data is divided into 100 sec bins |
 |
 |
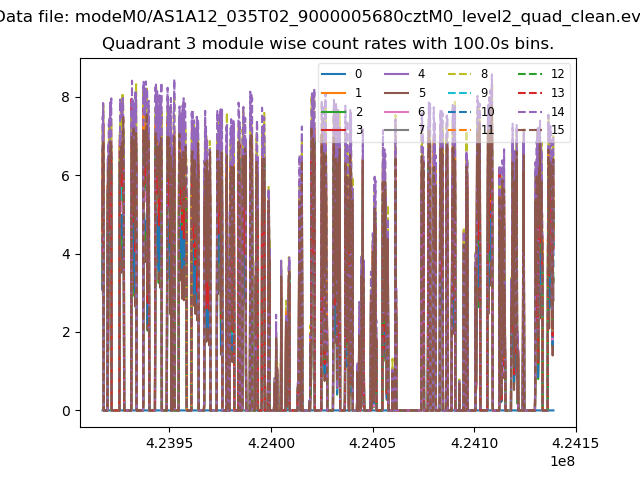
| Module-wise count rates for Quadrant C Data is divided into 100 sec bins |
 |
 |
| Module-wise count rates for Quadrant D Data is divided into 100 sec bins |
 |
 |
| Parameter | Plot |
|---|---|
| CZT HV Monitor |  |
| D_VDD | 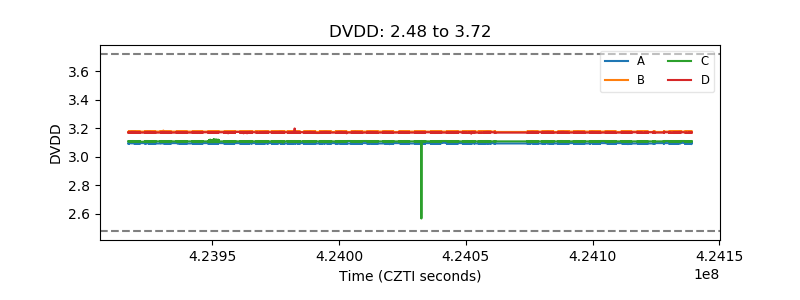 |
| Temperature 1 | 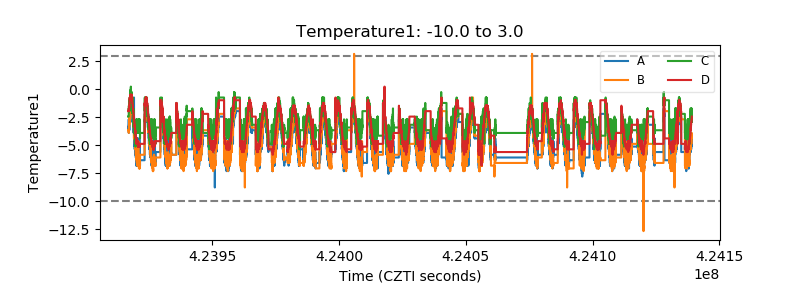 |
| Veto HV Monitor |  |
| Veto LLD |  |
| Alpha Counter |  |
| _CPM_Rate | 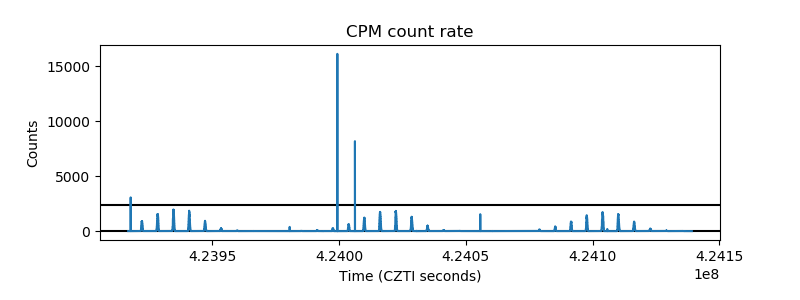 |
| CZT Counter |  |
| +2.5 Volts monitor |  |
| +5 Volts monitor |  |
| _ROLL_ROT |  |
| _Roll_DEC |  |
| _Roll_RA | 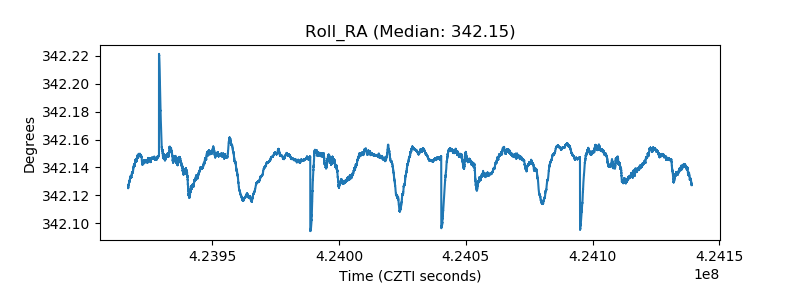 |
| Veto Counter | 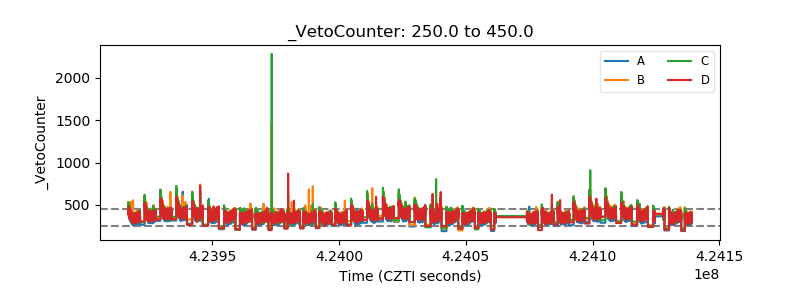 |