| Param | Original file | Final file |
|---|---|---|
| Filename | modeM0/AS1C07_001T10_9000005678cztM0_level2.fits | modeM0/AS1C07_001T10_9000005678cztM0_level2_quad_clean.evt |
| Size (bytes) | 740,796,480 | 937,065,600 |
| Size | 706.5 MB | 893.7 MB |
| Events in quadrant A | 4,447,068 | 6,018,373 |
| Events in quadrant B | 4,279,652 | 6,017,089 |
| Events in quadrant C | 4,205,924 | 5,456,625 |
| Events in quadrant D | 3,706,976 | 5,098,928 |
| Mode SS | |||
|---|---|---|---|
| Quadrant | BADHDUFLAG | Total packets | Discarded packets |
| A | 0 | 1726 | 0 |
| B | 0 | 1726 | 0 |
| C | 0 | 1726 | 0 |
| D | 0 | 1726 | 0 |
| Mode M0 | |||
|---|---|---|---|
| Quadrant | BADHDUFLAG | Total packets | Discarded packets |
| A | 0 | 182508 | 0 |
| B | 0 | 183704 | 0 |
| C | 0 | 228335 | 0 |
| D | 0 | 226751 | 0 |
| Mode M9 | |||
|---|---|---|---|
| Quadrant | BADHDUFLAG | Total packets | Discarded packets |
| A | 0 | 308 | 0 |
| B | 0 | 308 | 0 |
| C | 0 | 308 | 0 |
| D | 0 | 308 | 0 |
| Quadrant | Total seconds | Saturated seconds | Saturation percentage |
|---|---|---|---|
| A | 84464 | 225 | 0.266386% |
| B | 84464 | 329 | 0.389515% |
| C | 84464 | 7211 | 8.537365% |
| D | 84464 | 4532 | 5.365600% |
Noise dominated data is calculated using 1-second bins in cleaned event files. If a bin has >2000 counts, and if more than 50% of those come from <1% of pixels, then it is considered to be noise-dominated and hence unusable.
| Quadrant | # 1 sec bins | Bins with >0 counts | Bins with >2000 counts | High rate bins dominated by noise | Noise dominated (total time) | Noise dominated (detector-on time) | Marked lightcurve |
|---|---|---|---|---|---|---|---|
| A | 113843 | 84463 | 0 | 0 | 0.00% | 0.00% |  |
| B | 113843 | 84463 | 0 | 0 | 0.00% | 0.00% |  |
| C | 113842 | 83960 | 0 | 0 | 0.00% | 0.00% |  |
| D | 113843 | 84229 | 0 | 0 | 0.00% | 0.00% |  |
Top three noisy pixels from each quadrant. If the there are fewer than three noisy pixels in the level2.evt file, extra rows are filled as -1
| Pixel properties | Quadrant properties | ||||||
|---|---|---|---|---|---|---|---|
| Quadrant | DetID | PixID | Counts | Sigma | Mean | Median | Sigma |
| A | 0 | 29 | 3654 | 8.72 | 1163 | 1089 | 294.2 |
| A | 9 | 19 | 3624 | 8.62 | 1163 | 1089 | 294.2 |
| A | 7 | 110 | 3574 | 8.45 | 1163 | 1089 | 294.2 |
| B | 2 | 9 | 3662 | 11.88 | 1132 | 1081 | 217.3 |
| B | 3 | 80 | 3224 | 9.86 | 1132 | 1081 | 217.3 |
| B | 3 | 17 | 3031 | 8.97 | 1132 | 1081 | 217.3 |
| C | 1 | 81 | 3574 | 8.91 | 1111 | 1043 | 284.1 |
| C | 1 | 80 | 3465 | 8.53 | 1111 | 1043 | 284.1 |
| C | 3 | 202 | 3324 | 8.03 | 1111 | 1043 | 284.1 |
| D | 7 | 3 | 2783 | 6.44 | 1062 | 970 | 281.6 |
| D | 4 | 160 | 2738 | 6.28 | 1062 | 970 | 281.6 |
| D | 6 | 62 | 2711 | 6.18 | 1062 | 970 | 281.6 |
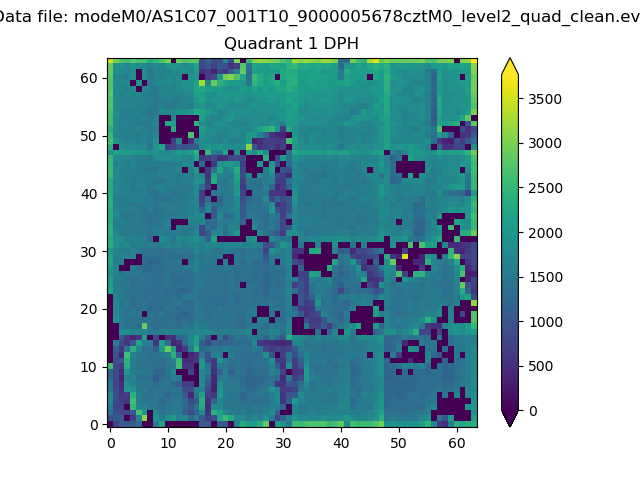
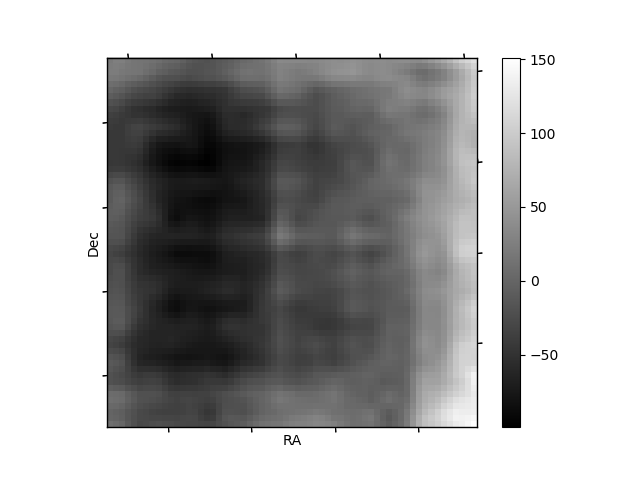
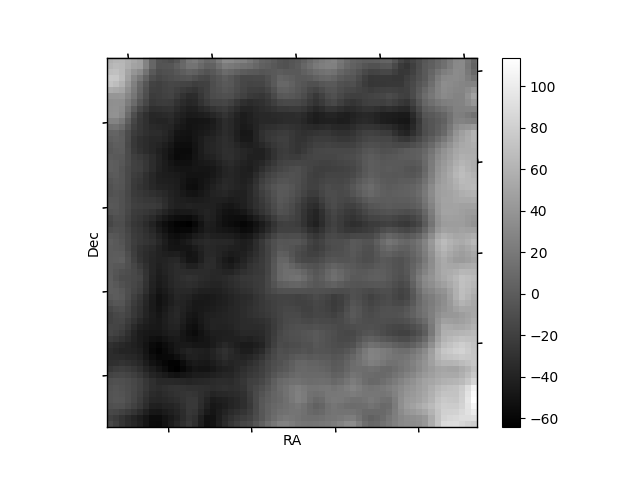
Histogram calculated using DETX and DETY for each event in the final _common_clean file
| Quadrant A |  |
 |
Quadrant B |
|---|---|---|---|
| Quadrant D |  |
 |
Quadrant C |
| Plot type | Count rate plots | Images |
|---|---|---|
| Comparison with Poisson distribution Blue bars denote a histogram of data divided into 1 sec bins. Red curve is a Poisson curve with rate = median count rate of data. |
 |
 |
| Quadrant-wise count rates Data is divided into 100 sec bins |
 |
|
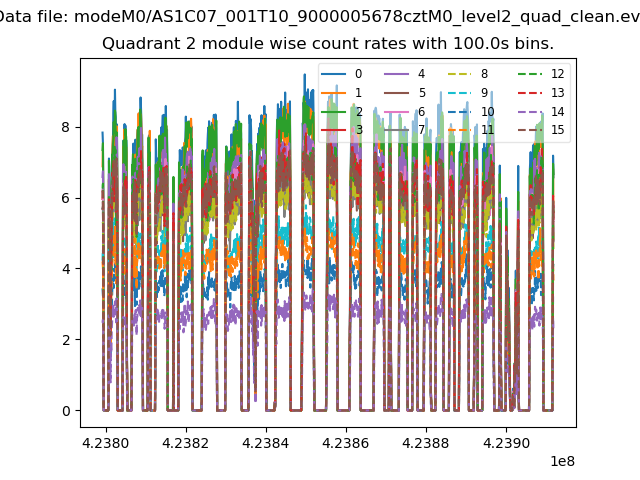
| Module-wise count rates for Quadrant A Data is divided into 100 sec bins |
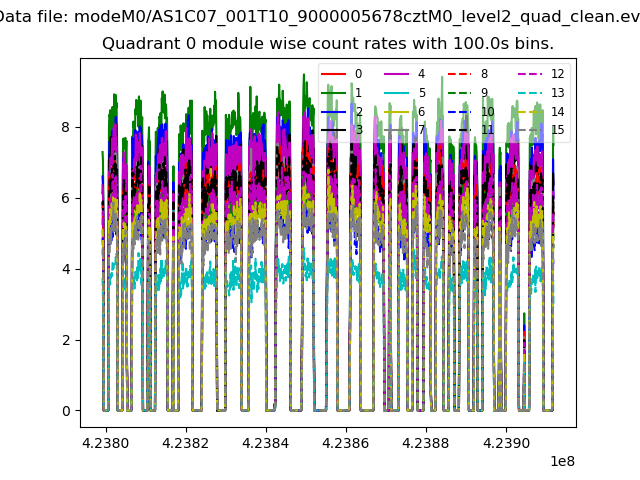 |
 |
| Module-wise count rates for Quadrant B Data is divided into 100 sec bins |
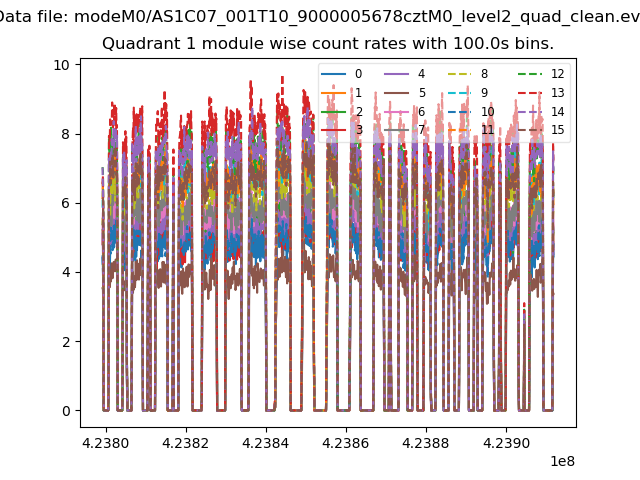 |
 |
| Module-wise count rates for Quadrant C Data is divided into 100 sec bins |
 |
 |
| Module-wise count rates for Quadrant D Data is divided into 100 sec bins |
 |
 |
| Parameter | Plot |
|---|---|
| CZT HV Monitor |  |
| D_VDD | 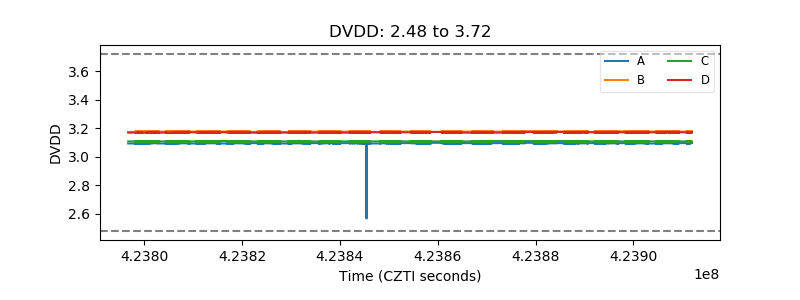 |
| Temperature 1 |  |
| Veto HV Monitor |  |
| Veto LLD |  |
| Alpha Counter | 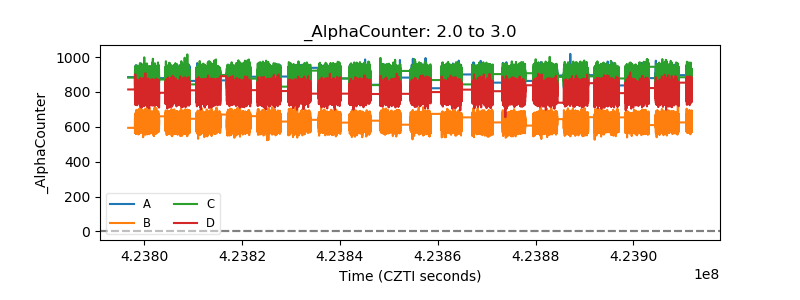 |
| _CPM_Rate |  |
| CZT Counter |  |
| +2.5 Volts monitor |  |
| +5 Volts monitor | 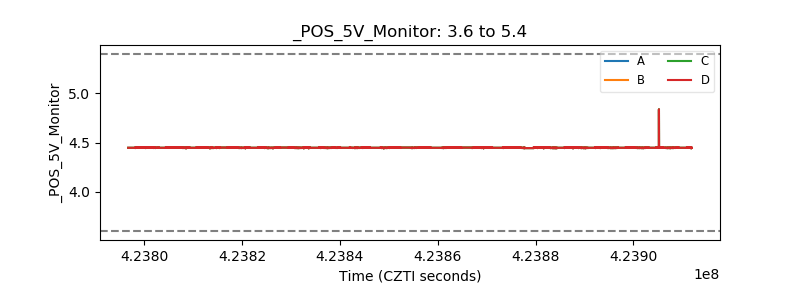 |
| _ROLL_ROT |  |
| _Roll_DEC |  |
| _Roll_RA |  |
| Veto Counter |  |