| Param | Original file | Final file |
|---|---|---|
| Filename | modeM0/AS1T05_110T01_9000005672cztM0_level2.fits | modeM0/AS1T05_110T01_9000005672cztM0_level2_quad_clean.evt |
| Size (bytes) | 161,121,600 | 215,881,920 |
| Size | 153.7 MB | 205.9 MB |
| Events in quadrant A | 953,822 | 1,382,844 |
| Events in quadrant B | 919,352 | 1,384,104 |
| Events in quadrant C | 923,558 | 1,303,208 |
| Events in quadrant D | 805,956 | 1,191,424 |
| Mode SS | |||
|---|---|---|---|
| Quadrant | BADHDUFLAG | Total packets | Discarded packets |
| A | 0 | 378 | 0 |
| B | 0 | 378 | 0 |
| C | 0 | 378 | 0 |
| D | 0 | 378 | 0 |
| Mode M0 | |||
|---|---|---|---|
| Quadrant | BADHDUFLAG | Total packets | Discarded packets |
| A | 0 | 39598 | 0 |
| B | 0 | 38988 | 0 |
| C | 0 | 40456 | 0 |
| D | 0 | 45485 | 0 |
| Mode M9 | |||
|---|---|---|---|
| Quadrant | BADHDUFLAG | Total packets | Discarded packets |
| A | 0 | 54 | 0 |
| B | 0 | 54 | 0 |
| C | 0 | 54 | 0 |
| D | 0 | 54 | 0 |
| Quadrant | Total seconds | Saturated seconds | Saturation percentage |
|---|---|---|---|
| A | 18530 | 65 | 0.350783% |
| B | 18530 | 53 | 0.286023% |
| C | 18530 | 428 | 2.309768% |
| D | 18530 | 482 | 2.601187% |
Noise dominated data is calculated using 1-second bins in cleaned event files. If a bin has >2000 counts, and if more than 50% of those come from <1% of pixels, then it is considered to be noise-dominated and hence unusable.
| Quadrant | # 1 sec bins | Bins with >0 counts | Bins with >2000 counts | High rate bins dominated by noise | Noise dominated (total time) | Noise dominated (detector-on time) | Marked lightcurve |
|---|---|---|---|---|---|---|---|
| A | 23902 | 18531 | 0 | 0 | 0.00% | 0.00% |  |
| B | 23902 | 18530 | 0 | 0 | 0.00% | 0.00% |  |
| C | 23902 | 18506 | 0 | 0 | 0.00% | 0.00% |  |
| D | 23902 | 18525 | 0 | 0 | 0.00% | 0.00% | 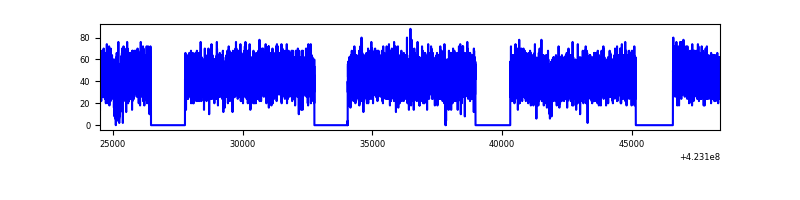 |
Top three noisy pixels from each quadrant. If the there are fewer than three noisy pixels in the level2.evt file, extra rows are filled as -1
| Pixel properties | Quadrant properties | ||||||
|---|---|---|---|---|---|---|---|
| Quadrant | DetID | PixID | Counts | Sigma | Mean | Median | Sigma |
| A | 9 | 19 | 816 | 8.86 | 248 | 232 | 65.9 |
| A | 7 | 110 | 771 | 8.18 | 248 | 232 | 65.9 |
| A | 15 | 236 | 748 | 7.83 | 248 | 232 | 65.9 |
| B | 2 | 9 | 784 | 11.19 | 243 | 232 | 49.3 |
| B | 3 | 80 | 653 | 8.53 | 243 | 232 | 49.3 |
| B | 2 | 8 | 651 | 8.49 | 243 | 232 | 49.3 |
| C | 1 | 81 | 786 | 8.68 | 244 | 228 | 64.3 |
| C | 1 | 80 | 733 | 7.85 | 244 | 228 | 64.3 |
| C | 1 | 65 | 656 | 6.66 | 244 | 228 | 64.3 |
| D | 10 | 189 | 637 | 6.71 | 230 | 209 | 63.8 |
| D | 4 | 160 | 607 | 6.24 | 230 | 209 | 63.8 |
| D | 6 | 38 | 594 | 6.03 | 230 | 209 | 63.8 |
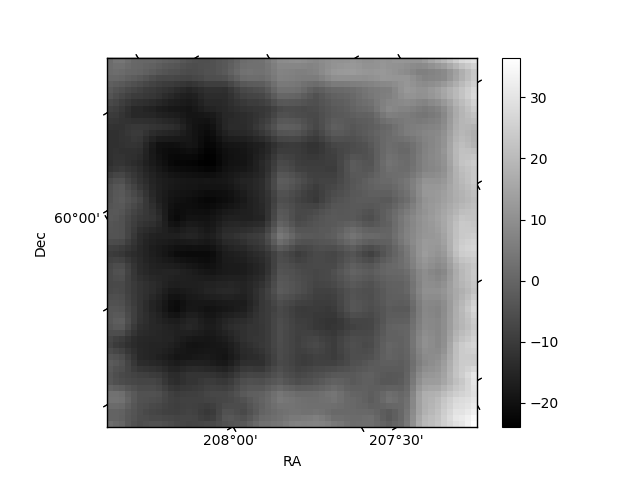
Histogram calculated using DETX and DETY for each event in the final _common_clean file
| Quadrant A | 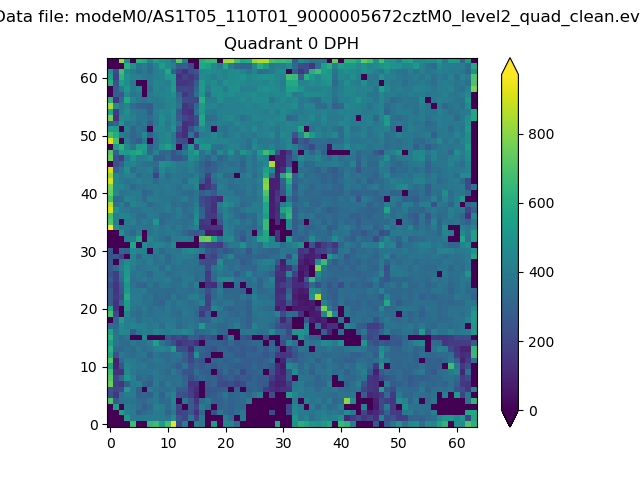 |
 |
Quadrant B |
|---|---|---|---|
| Quadrant D |  |
 |
Quadrant C |
| Plot type | Count rate plots | Images |
|---|---|---|
| Comparison with Poisson distribution Blue bars denote a histogram of data divided into 1 sec bins. Red curve is a Poisson curve with rate = median count rate of data. |
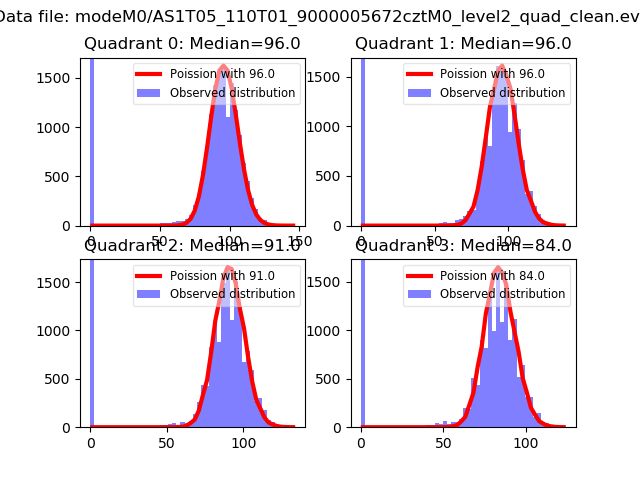 |
 |
| Quadrant-wise count rates Data is divided into 100 sec bins |
 |
|
| Module-wise count rates for Quadrant A Data is divided into 100 sec bins |
 |
 |
| Module-wise count rates for Quadrant B Data is divided into 100 sec bins |
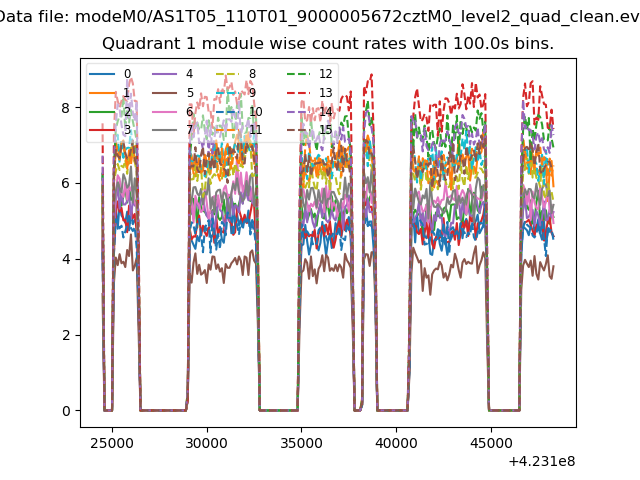 |
 |
| Module-wise count rates for Quadrant C Data is divided into 100 sec bins |
 |
 |
| Module-wise count rates for Quadrant D Data is divided into 100 sec bins |
 |
 |
| Parameter | Plot |
|---|---|
| CZT HV Monitor | 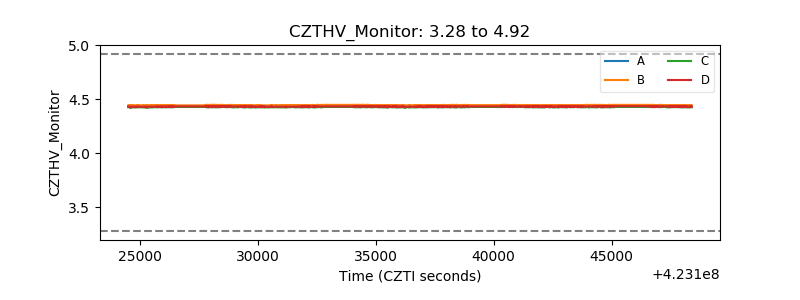 |
| D_VDD |  |
| Temperature 1 |  |
| Veto HV Monitor |  |
| Veto LLD |  |
| Alpha Counter | 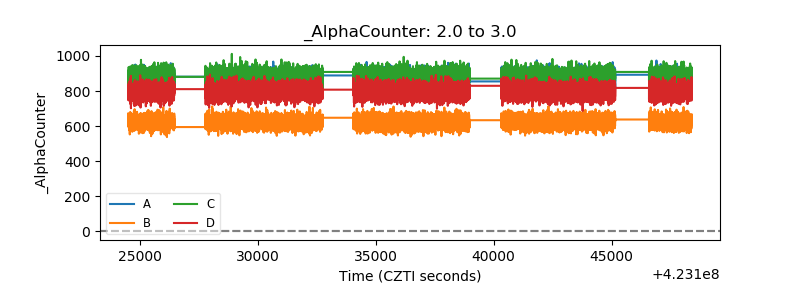 |
| _CPM_Rate |  |
| CZT Counter |  |
| +2.5 Volts monitor |  |
| +5 Volts monitor |  |
| _ROLL_ROT |  |
| _Roll_DEC |  |
| _Roll_RA |  |
| Veto Counter | 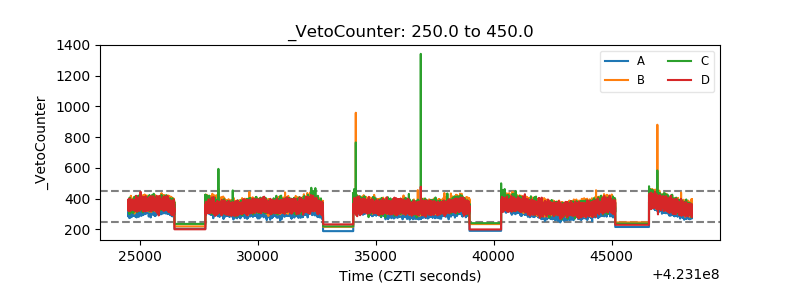 |