| Param | Original file | Final file |
|---|---|---|
| Filename | modeM0/AS1A12_014T01_9000005674cztM0_level2.fits | modeM0/AS1A12_014T01_9000005674cztM0_level2_quad_clean.evt |
| Size (bytes) | 303,799,680 | 413,798,400 |
| Size | 289.7 MB | 394.6 MB |
| Events in quadrant A | 1,817,458 | 2,634,604 |
| Events in quadrant B | 1,756,542 | 2,679,512 |
| Events in quadrant C | 1,749,504 | 2,552,843 |
| Events in quadrant D | 1,524,676 | 2,314,448 |
| Mode SS | |||
|---|---|---|---|
| Quadrant | BADHDUFLAG | Total packets | Discarded packets |
| A | 0 | 702 | 0 |
| B | 0 | 702 | 0 |
| C | 0 | 702 | 0 |
| D | 0 | 702 | 0 |
| Mode M9 | |||
|---|---|---|---|
| Quadrant | BADHDUFLAG | Total packets | Discarded packets |
| A | 0 | 153 | 0 |
| B | 0 | 153 | 0 |
| C | 0 | 153 | 0 |
| D | 0 | 153 | 0 |
| Mode M0 | |||
|---|---|---|---|
| Quadrant | BADHDUFLAG | Total packets | Discarded packets |
| A | 0 | 73110 | 0 |
| B | 0 | 73293 | 0 |
| C | 0 | 79972 | 0 |
| D | 0 | 95600 | 0 |
| Quadrant | Total seconds | Saturated seconds | Saturation percentage |
|---|---|---|---|
| A | 34224 | 76 | 0.222066% |
| B | 34224 | 219 | 0.639902% |
| C | 34224 | 1258 | 3.675783% |
| D | 34224 | 1100 | 3.214119% |
Noise dominated data is calculated using 1-second bins in cleaned event files. If a bin has >2000 counts, and if more than 50% of those come from <1% of pixels, then it is considered to be noise-dominated and hence unusable.
| Quadrant | # 1 sec bins | Bins with >0 counts | Bins with >2000 counts | High rate bins dominated by noise | Noise dominated (total time) | Noise dominated (detector-on time) | Marked lightcurve |
|---|---|---|---|---|---|---|---|
| A | 49584 | 34224 | 0 | 0 | 0.00% | 0.00% |  |
| B | 49584 | 34198 | 0 | 0 | 0.00% | 0.00% |  |
| C | 49584 | 33975 | 0 | 0 | 0.00% | 0.00% |  |
| D | 49584 | 34217 | 0 | 0 | 0.00% | 0.00% |  |
Top three noisy pixels from each quadrant. If the there are fewer than three noisy pixels in the level2.evt file, extra rows are filled as -1
| Pixel properties | Quadrant properties | ||||||
|---|---|---|---|---|---|---|---|
| Quadrant | DetID | PixID | Counts | Sigma | Mean | Median | Sigma |
| A | 0 | 29 | 1495 | 8.63 | 475 | 448 | 121.3 |
| A | 7 | 110 | 1477 | 8.49 | 475 | 448 | 121.3 |
| A | 9 | 19 | 1466 | 8.4 | 475 | 448 | 121.3 |
| B | 2 | 9 | 1532 | 11.91 | 465 | 446 | 91.2 |
| B | 5 | 128 | 1266 | 8.99 | 465 | 446 | 91.2 |
| B | 3 | 80 | 1250 | 8.82 | 465 | 446 | 91.2 |
| C | 1 | 81 | 1507 | 8.87 | 462 | 434 | 121.0 |
| C | 1 | 80 | 1422 | 8.16 | 462 | 434 | 121.0 |
| C | 3 | 203 | 1345 | 7.53 | 462 | 434 | 121.0 |
| D | 10 | 189 | 1176 | 6.57 | 436 | 395 | 118.9 |
| D | 7 | 3 | 1150 | 6.35 | 436 | 395 | 118.9 |
| D | 4 | 160 | 1149 | 6.34 | 436 | 395 | 118.9 |
Histogram calculated using DETX and DETY for each event in the final _common_clean file
| Quadrant A |  |
 |
Quadrant B |
|---|---|---|---|
| Quadrant D |  |
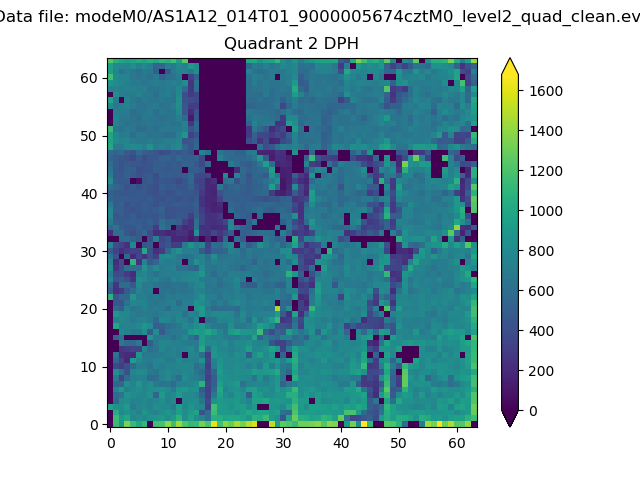 |
Quadrant C |
| Plot type | Count rate plots | Images |
|---|---|---|
| Comparison with Poisson distribution Blue bars denote a histogram of data divided into 1 sec bins. Red curve is a Poisson curve with rate = median count rate of data. |
 |
 |
| Quadrant-wise count rates Data is divided into 100 sec bins |
 |
|
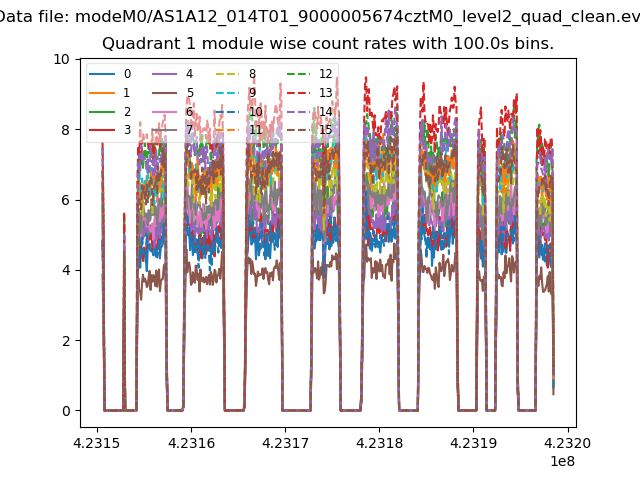
| Module-wise count rates for Quadrant A Data is divided into 100 sec bins |
 |
 |
| Module-wise count rates for Quadrant B Data is divided into 100 sec bins |
 |
 |
| Module-wise count rates for Quadrant C Data is divided into 100 sec bins |
 |
 |
| Module-wise count rates for Quadrant D Data is divided into 100 sec bins |
 |
 |
| Parameter | Plot |
|---|---|
| CZT HV Monitor |  |
| D_VDD |  |
| Temperature 1 |  |
| Veto HV Monitor |  |
| Veto LLD |  |
| Alpha Counter |  |
| _CPM_Rate |  |
| CZT Counter | 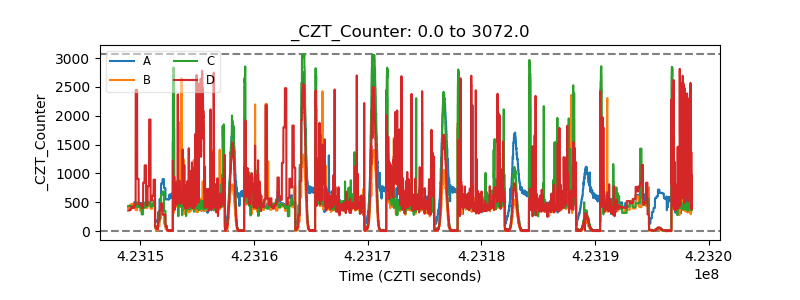 |
| +2.5 Volts monitor |  |
| +5 Volts monitor |  |
| _ROLL_ROT |  |
| _Roll_DEC | 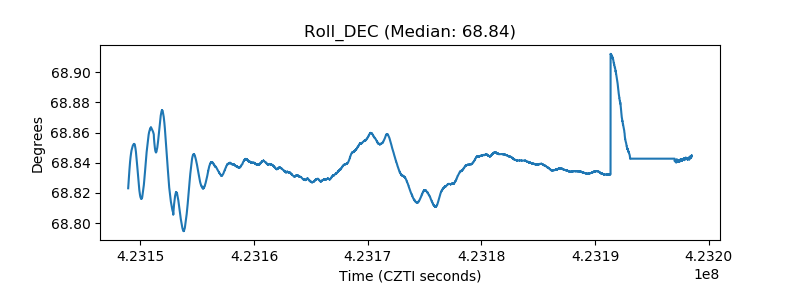 |
| _Roll_RA |  |
| Veto Counter | 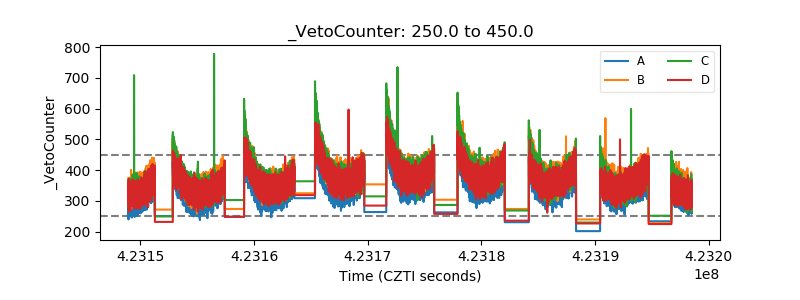 |