| Param | Original file | Final file |
|---|---|---|
| Filename | modeM0/AS1C06_010T05_9000005670cztM0_level2.fits | modeM0/AS1C06_010T05_9000005670cztM0_level2_quad_clean.evt |
| Size (bytes) | 160,778,880 | 235,886,400 |
| Size | 153.3 MB | 225.0 MB |
| Events in quadrant A | 956,520 | 1,538,189 |
| Events in quadrant B | 920,846 | 1,562,022 |
| Events in quadrant C | 919,452 | 1,444,142 |
| Events in quadrant D | 799,210 | 1,326,863 |
| Mode M9 | |||
|---|---|---|---|
| Quadrant | BADHDUFLAG | Total packets | Discarded packets |
| A | 0 | 76 | 0 |
| B | 0 | 76 | 0 |
| C | 0 | 76 | 0 |
| D | 0 | 76 | 0 |
| Mode SS | |||
|---|---|---|---|
| Quadrant | BADHDUFLAG | Total packets | Discarded packets |
| A | 0 | 376 | 0 |
| B | 0 | 376 | 0 |
| C | 0 | 376 | 0 |
| D | 0 | 376 | 0 |
| Mode M0 | |||
|---|---|---|---|
| Quadrant | BADHDUFLAG | Total packets | Discarded packets |
| A | 0 | 39284 | 0 |
| B | 0 | 38697 | 0 |
| C | 0 | 40685 | 0 |
| D | 0 | 46312 | 0 |
| Quadrant | Total seconds | Saturated seconds | Saturation percentage |
|---|---|---|---|
| A | 18478 | 45 | 0.243533% |
| B | 18477 | 30 | 0.162364% |
| C | 18478 | 479 | 2.592272% |
| D | 18478 | 531 | 2.873688% |
Noise dominated data is calculated using 1-second bins in cleaned event files. If a bin has >2000 counts, and if more than 50% of those come from <1% of pixels, then it is considered to be noise-dominated and hence unusable.
| Quadrant | # 1 sec bins | Bins with >0 counts | Bins with >2000 counts | High rate bins dominated by noise | Noise dominated (total time) | Noise dominated (detector-on time) | Marked lightcurve |
|---|---|---|---|---|---|---|---|
| A | 26070 | 18478 | 0 | 0 | 0.00% | 0.00% |  |
| B | 26070 | 18478 | 0 | 0 | 0.00% | 0.00% |  |
| C | 26070 | 18430 | 0 | 0 | 0.00% | 0.00% |  |
| D | 26070 | 18475 | 0 | 0 | 0.00% | 0.00% | 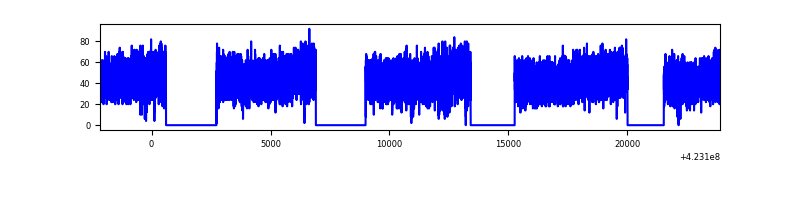 |
Top three noisy pixels from each quadrant. If the there are fewer than three noisy pixels in the level2.evt file, extra rows are filled as -1
| Pixel properties | Quadrant properties | ||||||
|---|---|---|---|---|---|---|---|
| Quadrant | DetID | PixID | Counts | Sigma | Mean | Median | Sigma |
| A | 0 | 29 | 779 | 8.38 | 250 | 236 | 64.8 |
| A | 9 | 19 | 762 | 8.12 | 250 | 236 | 64.8 |
| A | 7 | 110 | 756 | 8.03 | 250 | 236 | 64.8 |
| B | 2 | 9 | 787 | 11.29 | 244 | 233 | 49.1 |
| B | 5 | 128 | 665 | 8.8 | 244 | 233 | 49.1 |
| B | 3 | 80 | 659 | 8.68 | 244 | 233 | 49.1 |
| C | 3 | 202 | 745 | 8.12 | 243 | 227 | 63.8 |
| C | 1 | 81 | 726 | 7.82 | 243 | 227 | 63.8 |
| C | 3 | 203 | 720 | 7.72 | 243 | 227 | 63.8 |
| D | 7 | 3 | 619 | 6.52 | 228 | 208 | 63.1 |
| D | 6 | 67 | 575 | 5.82 | 228 | 208 | 63.1 |
| D | 6 | 83 | 568 | 5.71 | 228 | 208 | 63.1 |
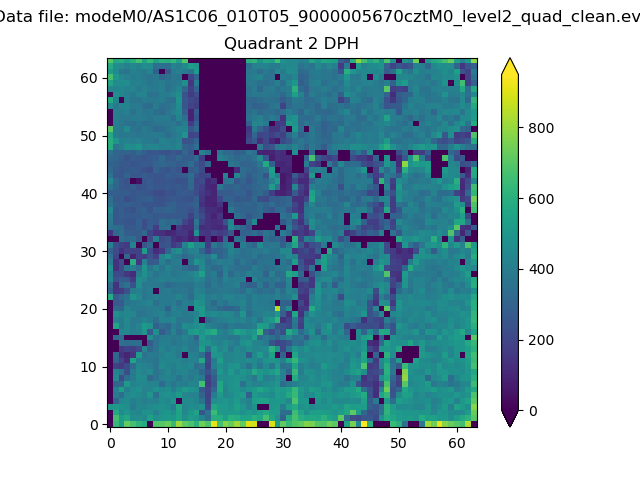
Histogram calculated using DETX and DETY for each event in the final _common_clean file
| Quadrant A |  |
 |
Quadrant B |
|---|---|---|---|
| Quadrant D |  |
 |
Quadrant C |
| Plot type | Count rate plots | Images |
|---|---|---|
| Comparison with Poisson distribution Blue bars denote a histogram of data divided into 1 sec bins. Red curve is a Poisson curve with rate = median count rate of data. |
 |
 |
| Quadrant-wise count rates Data is divided into 100 sec bins |
 |
|
| Module-wise count rates for Quadrant A Data is divided into 100 sec bins |
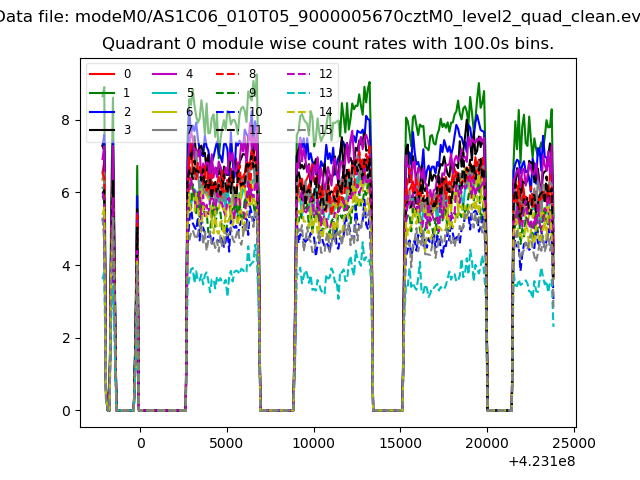 |
 |
| Module-wise count rates for Quadrant B Data is divided into 100 sec bins |
 |
 |
| Module-wise count rates for Quadrant C Data is divided into 100 sec bins |
 |
 |
| Module-wise count rates for Quadrant D Data is divided into 100 sec bins |
 |
 |
| Parameter | Plot |
|---|---|
| CZT HV Monitor |  |
| D_VDD |  |
| Temperature 1 | 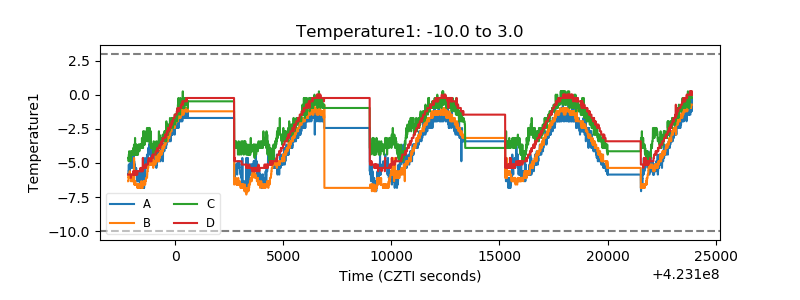 |
| Veto HV Monitor |  |
| Veto LLD | 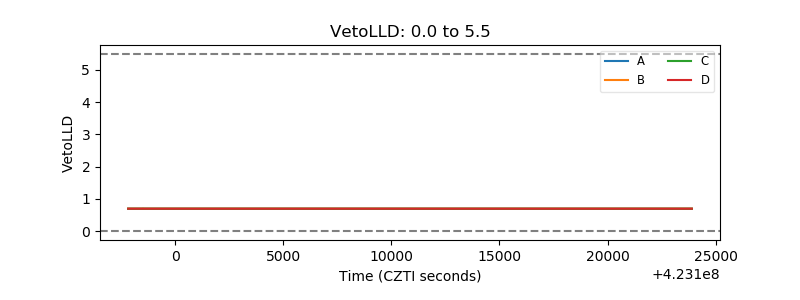 |
| Alpha Counter |  |
| _CPM_Rate |  |
| CZT Counter |  |
| +2.5 Volts monitor |  |
| +5 Volts monitor |  |
| _ROLL_ROT | 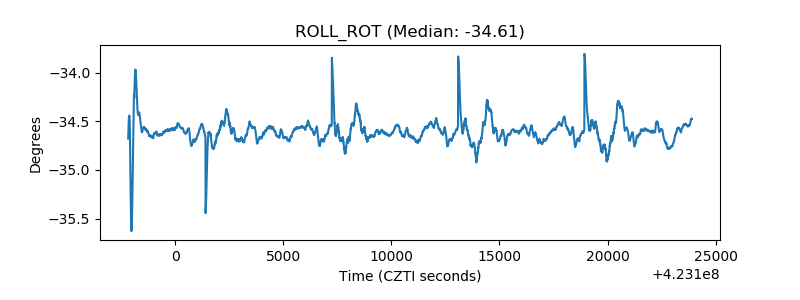 |
| _Roll_DEC |  |
| _Roll_RA |  |
| Veto Counter |  |