| Param | Original file | Final file |
|---|---|---|
| Filename | modeM0/AS1T05_100T01_9000005668cztM0_level2.fits | modeM0/AS1T05_100T01_9000005668cztM0_level2_quad_clean.evt |
| Size (bytes) | 692,210,880 | 682,669,440 |
| Size | 660.1 MB | 651.0 MB |
| Events in quadrant A | 4,150,016 | 4,032,761 |
| Events in quadrant B | 4,012,538 | 4,052,771 |
| Events in quadrant C | 3,992,862 | 3,808,853 |
| Events in quadrant D | 3,516,904 | 3,490,258 |
| Mode M9 | |||
|---|---|---|---|
| Quadrant | BADHDUFLAG | Total packets | Discarded packets |
| A | 0 | 316 | 0 |
| B | 0 | 316 | 0 |
| C | 0 | 316 | 0 |
| D | 0 | 317 | 0 |
| Mode SS | |||
|---|---|---|---|
| Quadrant | BADHDUFLAG | Total packets | Discarded packets |
| A | 0 | 1584 | 0 |
| B | 0 | 1582 | 0 |
| C | 0 | 1580 | 0 |
| D | 0 | 1572 | 0 |
| Mode M0 | |||
|---|---|---|---|
| Quadrant | BADHDUFLAG | Total packets | Discarded packets |
| A | 0 | 168610 | 0 |
| B | 0 | 158605 | 0 |
| C | 0 | 175307 | 0 |
| D | 0 | 189151 | 0 |
| Quadrant | Total seconds | Saturated seconds | Saturation percentage |
|---|---|---|---|
| A | 77112 | 236 | 0.306048% |
| B | 77144 | 312 | 0.404438% |
| C | 77170 | 2460 | 3.187767% |
| D | 77124 | 2095 | 2.716405% |
Noise dominated data is calculated using 1-second bins in cleaned event files. If a bin has >2000 counts, and if more than 50% of those come from <1% of pixels, then it is considered to be noise-dominated and hence unusable.
| Quadrant | # 1 sec bins | Bins with >0 counts | Bins with >2000 counts | High rate bins dominated by noise | Noise dominated (total time) | Noise dominated (detector-on time) | Marked lightcurve |
|---|---|---|---|---|---|---|---|
| A | 113364 | 77438 | 0 | 0 | 0.00% | 0.00% |  |
| B | 113364 | 77422 | 0 | 0 | 0.00% | 0.00% |  |
| C | 113364 | 77155 | 0 | 0 | 0.00% | 0.00% |  |
| D | 113364 | 77404 | 0 | 0 | 0.00% | 0.00% | 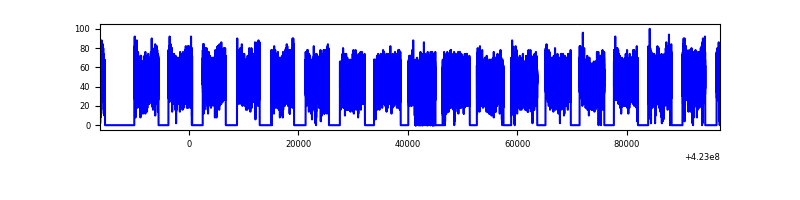 |
Top three noisy pixels from each quadrant. If the there are fewer than three noisy pixels in the level2.evt file, extra rows are filled as -1
| Pixel properties | Quadrant properties | ||||||
|---|---|---|---|---|---|---|---|
| Quadrant | DetID | PixID | Counts | Sigma | Mean | Median | Sigma |
| A | 9 | 19 | 3406 | 8.79 | 1083 | 1011 | 272.6 |
| A | 7 | 110 | 3393 | 8.74 | 1083 | 1011 | 272.6 |
| A | 0 | 29 | 3313 | 8.45 | 1083 | 1011 | 272.6 |
| B | 2 | 9 | 3461 | 11.91 | 1060 | 1009 | 206.0 |
| B | 3 | 17 | 2840 | 8.89 | 1060 | 1009 | 206.0 |
| B | 5 | 128 | 2811 | 8.75 | 1060 | 1009 | 206.0 |
| C | 1 | 81 | 3223 | 8.21 | 1054 | 984 | 272.8 |
| C | 1 | 80 | 3119 | 7.83 | 1054 | 984 | 272.8 |
| C | 3 | 202 | 3083 | 7.69 | 1054 | 984 | 272.8 |
| D | 7 | 3 | 2673 | 6.53 | 1003 | 914 | 269.4 |
| D | 10 | 189 | 2604 | 6.27 | 1003 | 914 | 269.4 |
| D | 3 | 14 | 2575 | 6.17 | 1003 | 914 | 269.4 |
Histogram calculated using DETX and DETY for each event in the final _common_clean file
| Quadrant A |  |
 |
Quadrant B |
|---|---|---|---|
| Quadrant D |  |
 |
Quadrant C |
| Plot type | Count rate plots | Images |
|---|---|---|
| Comparison with Poisson distribution Blue bars denote a histogram of data divided into 1 sec bins. Red curve is a Poisson curve with rate = median count rate of data. |
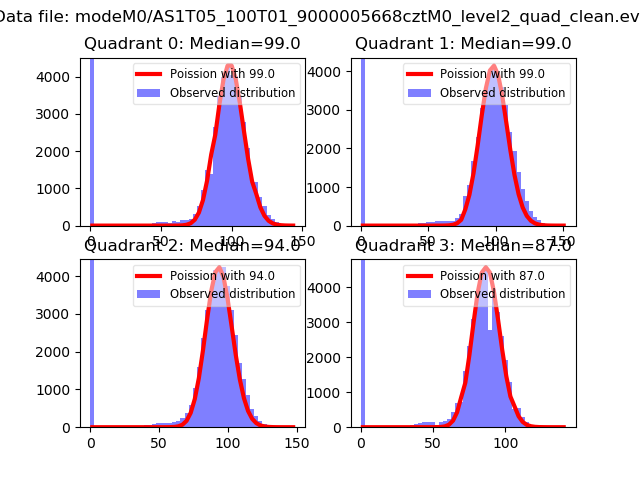 |
 |
| Quadrant-wise count rates Data is divided into 100 sec bins |
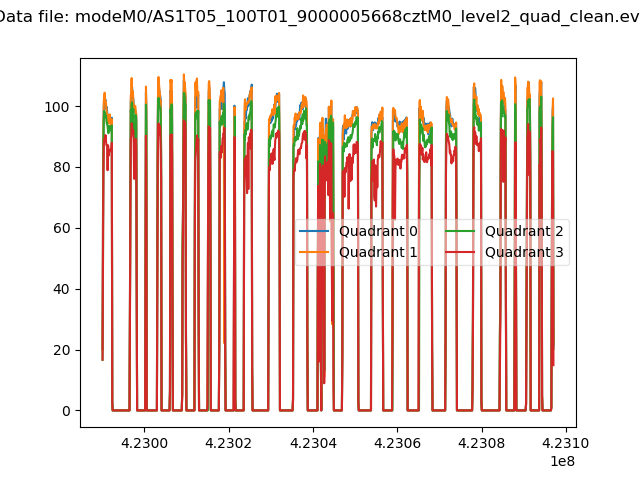 |
|
| Module-wise count rates for Quadrant A Data is divided into 100 sec bins |
 |
 |
| Module-wise count rates for Quadrant B Data is divided into 100 sec bins |
 |
 |
| Module-wise count rates for Quadrant C Data is divided into 100 sec bins |
 |
 |
| Module-wise count rates for Quadrant D Data is divided into 100 sec bins |
 |
 |
| Parameter | Plot |
|---|---|
| CZT HV Monitor |  |
| D_VDD |  |
| Temperature 1 |  |
| Veto HV Monitor |  |
| Veto LLD |  |
| Alpha Counter |  |
| _CPM_Rate |  |
| CZT Counter |  |
| +2.5 Volts monitor |  |
| +5 Volts monitor |  |
| _ROLL_ROT |  |
| _Roll_DEC |  |
| _Roll_RA |  |
| Veto Counter |  |