| Param | Original file | Final file |
|---|---|---|
| Filename | modeM0/AS1T05_105T01_9000005662cztM0_level2.fits | modeM0/AS1T05_105T01_9000005662cztM0_level2_quad_clean.evt |
| Size (bytes) | 389,442,240 | 381,107,520 |
| Size | 371.4 MB | 363.5 MB |
| Events in quadrant A | 2,363,280 | 2,254,907 |
| Events in quadrant B | 2,277,466 | 2,282,975 |
| Events in quadrant C | 2,274,686 | 2,128,162 |
| Events in quadrant D | 1,888,510 | 1,887,267 |
| Mode M9 | |||
|---|---|---|---|
| Quadrant | BADHDUFLAG | Total packets | Discarded packets |
| A | 0 | 167 | 0 |
| B | 0 | 167 | 0 |
| C | 0 | 167 | 0 |
| D | 0 | 167 | 0 |
| Mode SS | |||
|---|---|---|---|
| Quadrant | BADHDUFLAG | Total packets | Discarded packets |
| A | 0 | 888 | 0 |
| B | 0 | 888 | 0 |
| C | 0 | 888 | 0 |
| D | 0 | 888 | 0 |
| Mode M0 | |||
|---|---|---|---|
| Quadrant | BADHDUFLAG | Total packets | Discarded packets |
| A | 0 | 94003 | 0 |
| B | 0 | 90706 | 0 |
| C | 0 | 96627 | 0 |
| D | 0 | 149049 | 0 |
| Quadrant | Total seconds | Saturated seconds | Saturation percentage |
|---|---|---|---|
| A | 43531 | 137 | 0.314718% |
| B | 43531 | 369 | 0.847672% |
| C | 43531 | 1264 | 2.903678% |
| D | 43531 | 4264 | 9.795318% |
Noise dominated data is calculated using 1-second bins in cleaned event files. If a bin has >2000 counts, and if more than 50% of those come from <1% of pixels, then it is considered to be noise-dominated and hence unusable.
| Quadrant | # 1 sec bins | Bins with >0 counts | Bins with >2000 counts | High rate bins dominated by noise | Noise dominated (total time) | Noise dominated (detector-on time) | Marked lightcurve |
|---|---|---|---|---|---|---|---|
| A | 59994 | 43531 | 0 | 0 | 0.00% | 0.00% |  |
| B | 59994 | 43530 | 0 | 0 | 0.00% | 0.00% |  |
| C | 59988 | 43351 | 0 | 0 | 0.00% | 0.00% |  |
| D | 59994 | 43482 | 0 | 0 | 0.00% | 0.00% |  |
Top three noisy pixels from each quadrant. If the there are fewer than three noisy pixels in the level2.evt file, extra rows are filled as -1
| Pixel properties | Quadrant properties | ||||||
|---|---|---|---|---|---|---|---|
| Quadrant | DetID | PixID | Counts | Sigma | Mean | Median | Sigma |
| A | 7 | 110 | 2009 | 9.16 | 615 | 577 | 156.3 |
| A | 0 | 29 | 1904 | 8.49 | 615 | 577 | 156.3 |
| A | 9 | 19 | 1841 | 8.09 | 615 | 577 | 156.3 |
| B | 2 | 9 | 1953 | 11.63 | 601 | 571 | 118.8 |
| B | 3 | 80 | 1681 | 9.34 | 601 | 571 | 118.8 |
| B | 2 | 8 | 1566 | 8.38 | 601 | 571 | 118.8 |
| C | 1 | 81 | 1961 | 9.03 | 600 | 561 | 155.0 |
| C | 1 | 80 | 1892 | 8.58 | 600 | 561 | 155.0 |
| C | 3 | 202 | 1772 | 7.81 | 600 | 561 | 155.0 |
| D | 7 | 3 | 1418 | 6.34 | 540 | 491 | 146.1 |
| D | 6 | 83 | 1373 | 6.04 | 540 | 491 | 146.1 |
| D | 4 | 160 | 1365 | 5.98 | 540 | 491 | 146.1 |
Histogram calculated using DETX and DETY for each event in the final _common_clean file
| Quadrant A |  |
 |
Quadrant B |
|---|---|---|---|
| Quadrant D |  |
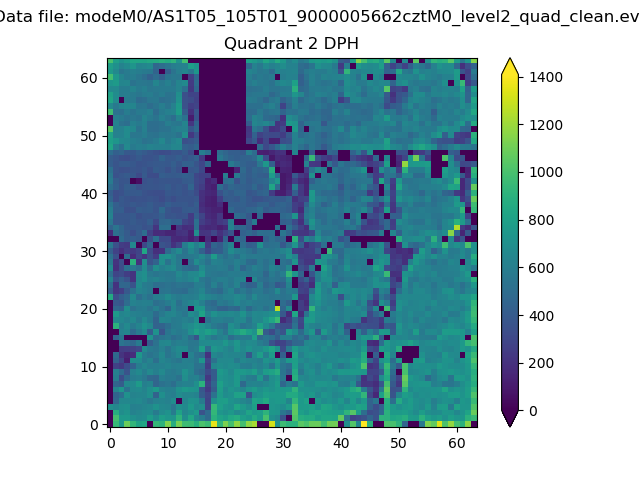 |
Quadrant C |
| Plot type | Count rate plots | Images |
|---|---|---|
| Comparison with Poisson distribution Blue bars denote a histogram of data divided into 1 sec bins. Red curve is a Poisson curve with rate = median count rate of data. |
 |
 |
| Quadrant-wise count rates Data is divided into 100 sec bins |
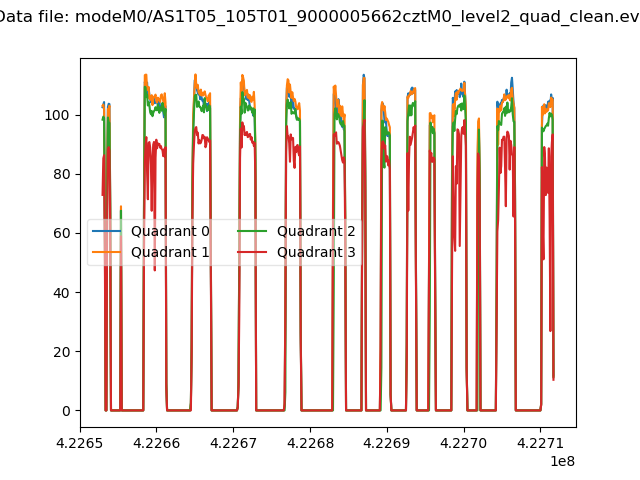 |
|
| Module-wise count rates for Quadrant A Data is divided into 100 sec bins |
 |
 |
| Module-wise count rates for Quadrant B Data is divided into 100 sec bins |
 |
 |
| Module-wise count rates for Quadrant C Data is divided into 100 sec bins |
 |
 |
| Module-wise count rates for Quadrant D Data is divided into 100 sec bins |
 |
 |
| Parameter | Plot |
|---|---|
| CZT HV Monitor |  |
| D_VDD |  |
| Temperature 1 |  |
| Veto HV Monitor |  |
| Veto LLD | 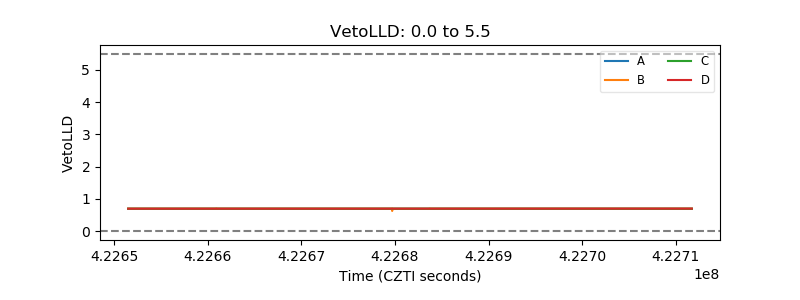 |
| Alpha Counter | 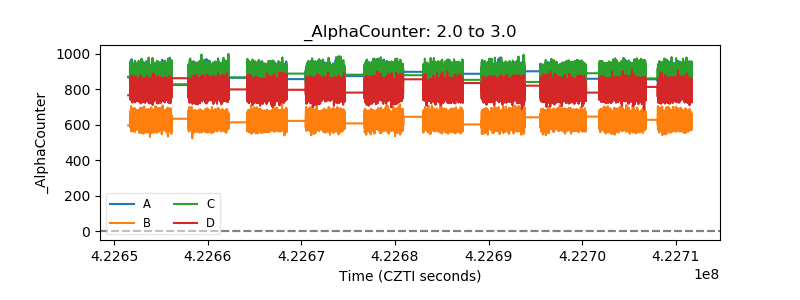 |
| _CPM_Rate |  |
| CZT Counter |  |
| +2.5 Volts monitor | 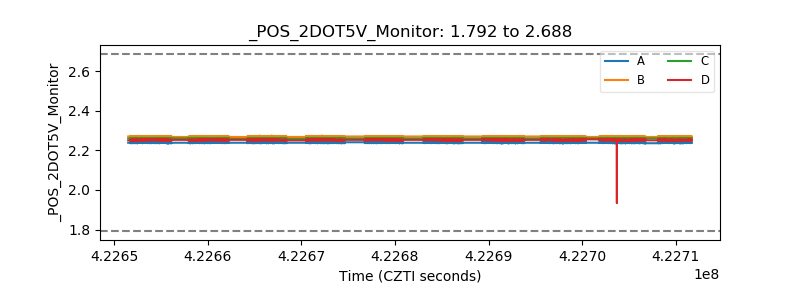 |
| +5 Volts monitor | 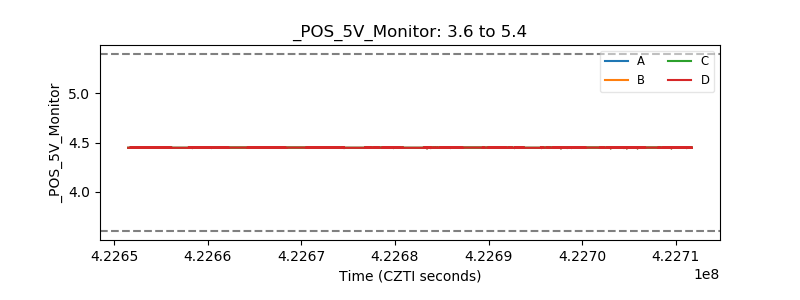 |
| _ROLL_ROT | 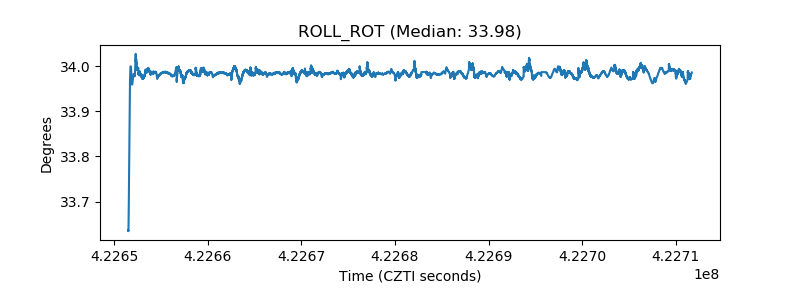 |
| _Roll_DEC | 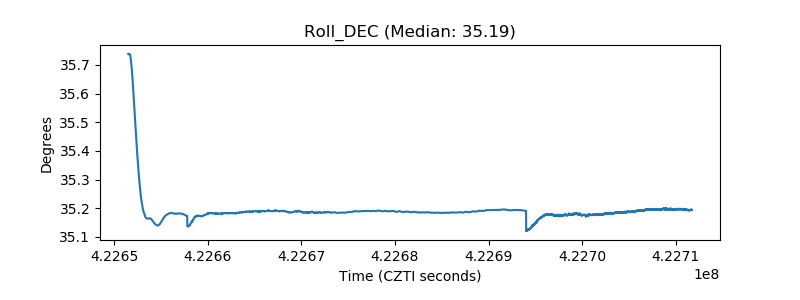 |
| _Roll_RA |  |
| Veto Counter |  |