| Param | Original file | Final file |
|---|---|---|
| Filename | modeM0/AS1A12_035T01_9000005660cztM0_level2.fits | modeM0/AS1A12_035T01_9000005660cztM0_level2_quad_clean.evt |
| Size (bytes) | 817,096,320 | 889,263,360 |
| Size | 779.2 MB | 848.1 MB |
| Events in quadrant A | 4,885,400 | 5,415,746 |
| Events in quadrant B | 4,692,234 | 5,446,308 |
| Events in quadrant C | 4,724,388 | 5,105,718 |
| Events in quadrant D | 4,081,666 | 4,605,320 |
| Mode M0 | |||
|---|---|---|---|
| Quadrant | BADHDUFLAG | Total packets | Discarded packets |
| A | 0 | 197565 | 0 |
| B | 0 | 195652 | 0 |
| C | 0 | 202581 | 0 |
| D | 0 | 258067 | 0 |
| Mode SS | |||
|---|---|---|---|
| Quadrant | BADHDUFLAG | Total packets | Discarded packets |
| A | 0 | 1894 | 0 |
| B | 0 | 1894 | 0 |
| C | 0 | 1894 | 0 |
| D | 0 | 1894 | 0 |
| Mode M9 | |||
|---|---|---|---|
| Quadrant | BADHDUFLAG | Total packets | Discarded packets |
| A | 0 | 329 | 0 |
| B | 0 | 329 | 0 |
| C | 0 | 329 | 0 |
| D | 0 | 329 | 0 |
| Quadrant | Total seconds | Saturated seconds | Saturation percentage |
|---|---|---|---|
| A | 92783 | 183 | 0.197234% |
| B | 92783 | 429 | 0.462369% |
| C | 92783 | 2134 | 2.299990% |
| D | 92783 | 4876 | 5.255273% |
Noise dominated data is calculated using 1-second bins in cleaned event files. If a bin has >2000 counts, and if more than 50% of those come from <1% of pixels, then it is considered to be noise-dominated and hence unusable.
| Quadrant | # 1 sec bins | Bins with >0 counts | Bins with >2000 counts | High rate bins dominated by noise | Noise dominated (total time) | Noise dominated (detector-on time) | Marked lightcurve |
|---|---|---|---|---|---|---|---|
| A | 123606 | 92781 | 0 | 0 | 0.00% | 0.00% | 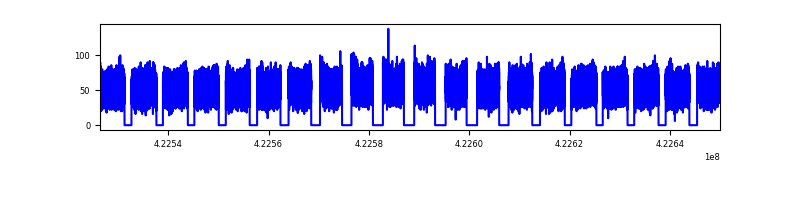 |
| B | 123606 | 92774 | 0 | 0 | 0.00% | 0.00% |  |
| C | 123605 | 92578 | 0 | 0 | 0.00% | 0.00% |  |
| D | 123606 | 92680 | 0 | 0 | 0.00% | 0.00% | 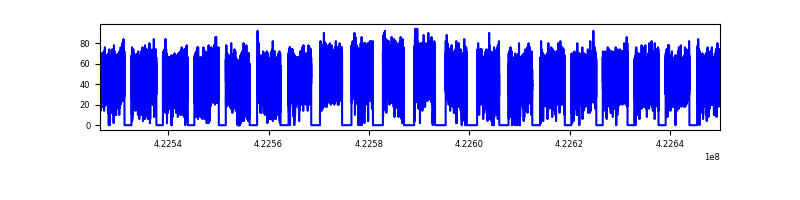 |
Top three noisy pixels from each quadrant. If the there are fewer than three noisy pixels in the level2.evt file, extra rows are filled as -1
| Pixel properties | Quadrant properties | ||||||
|---|---|---|---|---|---|---|---|
| Quadrant | DetID | PixID | Counts | Sigma | Mean | Median | Sigma |
| A | 9 | 19 | 4072 | 8.92 | 1273 | 1187 | 323.4 |
| A | 7 | 110 | 3986 | 8.65 | 1273 | 1187 | 323.4 |
| A | 0 | 29 | 3781 | 8.02 | 1273 | 1187 | 323.4 |
| B | 2 | 9 | 4013 | 11.65 | 1240 | 1178 | 243.3 |
| B | 3 | 80 | 3455 | 9.36 | 1240 | 1178 | 243.3 |
| B | 2 | 8 | 3347 | 8.91 | 1240 | 1178 | 243.3 |
| C | 1 | 81 | 4035 | 9.01 | 1248 | 1166 | 318.3 |
| C | 1 | 80 | 3737 | 8.08 | 1248 | 1166 | 318.3 |
| C | 1 | 65 | 3354 | 6.87 | 1248 | 1166 | 318.3 |
| D | 4 | 160 | 3010 | 6.27 | 1167 | 1064 | 310.4 |
| D | 10 | 189 | 2964 | 6.12 | 1167 | 1064 | 310.4 |
| D | 7 | 3 | 2961 | 6.11 | 1167 | 1064 | 310.4 |
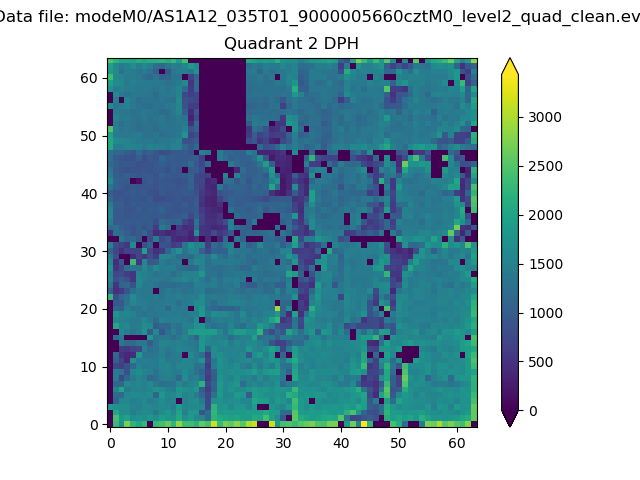
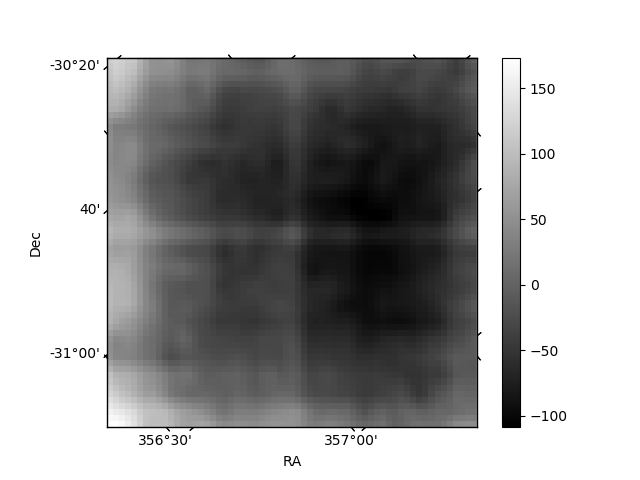
Histogram calculated using DETX and DETY for each event in the final _common_clean file
| Quadrant A | 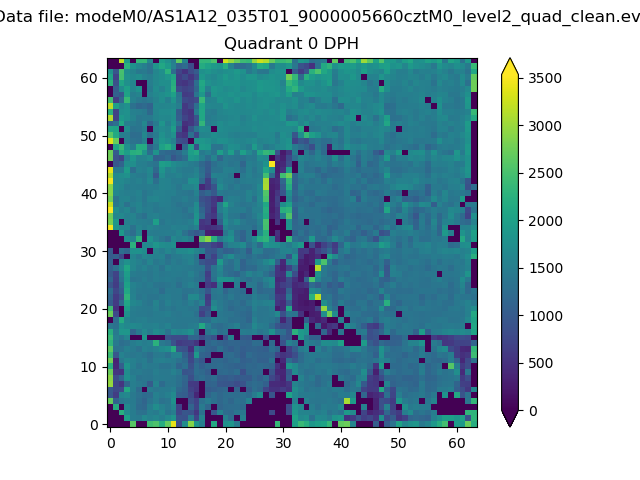 |
 |
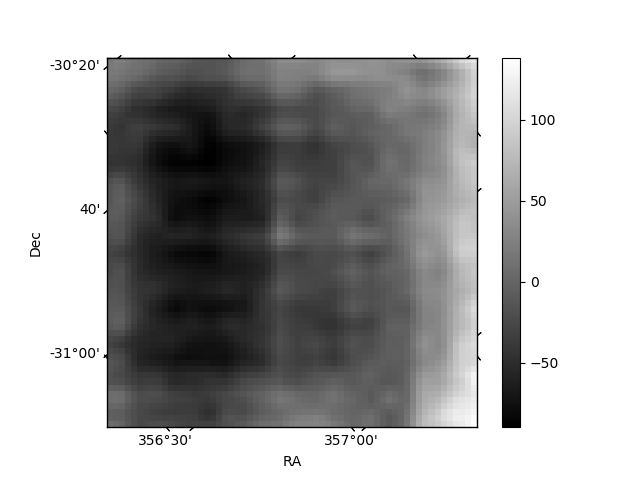
Quadrant B |
|---|---|---|---|
| Quadrant D |  |
 |
Quadrant C |
| Plot type | Count rate plots | Images |
|---|---|---|
| Comparison with Poisson distribution Blue bars denote a histogram of data divided into 1 sec bins. Red curve is a Poisson curve with rate = median count rate of data. |
 |
 |
| Quadrant-wise count rates Data is divided into 100 sec bins |
 |
|
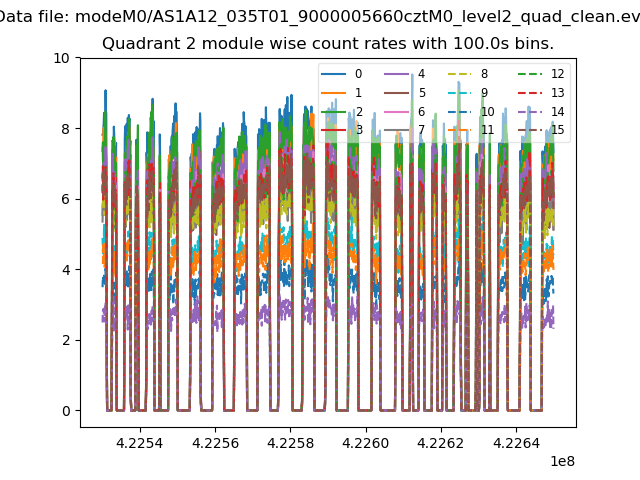
| Module-wise count rates for Quadrant A Data is divided into 100 sec bins |
 |
 |
| Module-wise count rates for Quadrant B Data is divided into 100 sec bins |
 |
 |
| Module-wise count rates for Quadrant C Data is divided into 100 sec bins |
 |
 |
| Module-wise count rates for Quadrant D Data is divided into 100 sec bins |
 |
 |
| Parameter | Plot |
|---|---|
| CZT HV Monitor | 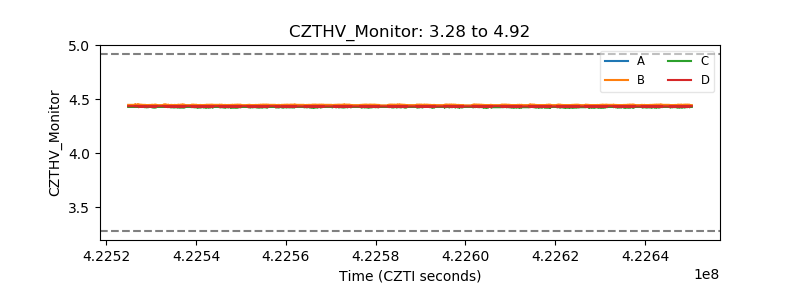 |
| D_VDD |  |
| Temperature 1 | 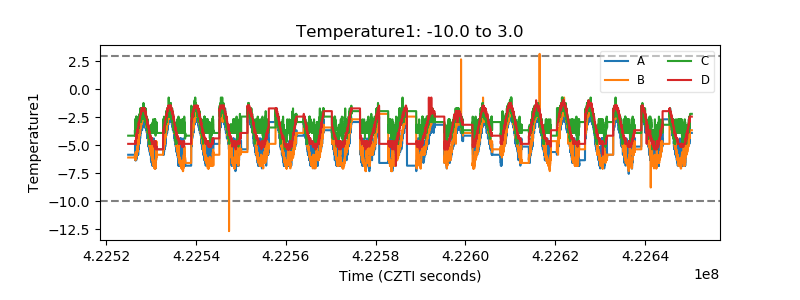 |
| Veto HV Monitor |  |
| Veto LLD |  |
| Alpha Counter |  |
| _CPM_Rate |  |
| CZT Counter |  |
| +2.5 Volts monitor |  |
| +5 Volts monitor |  |
| _ROLL_ROT |  |
| _Roll_DEC |  |
| _Roll_RA |  |
| Veto Counter |  |